AP Statistics Calculator Guide
Learn how an AP Statistics calculator works, what it calculates, and how to use it for homework and AP exam prep — free in your browser, no login needed.
Ap Stats Calculator
Ap Stats Calculator
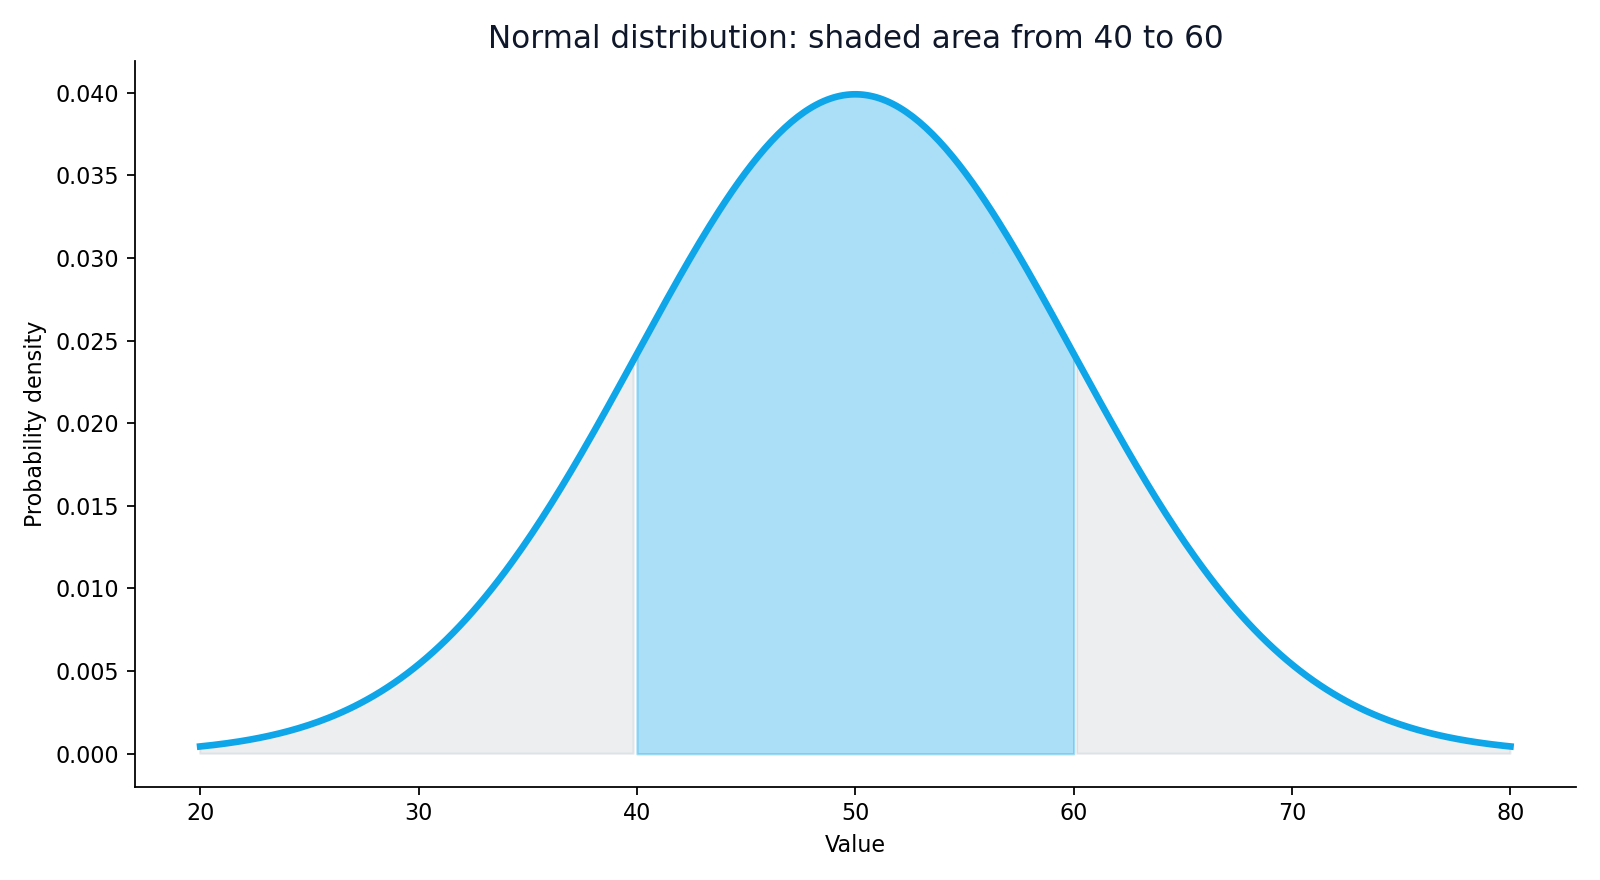
An AP Statistics calculator runs the calculations covered in AP Statistics. It finds probabilities, test statistics, p-values, confidence intervals, and regression lines, and it shows the values a teacher checks. Students use it to check homework, study for tests, and prepare for the AP Statistics exam, without doing every long calculation by hand.
Many students already have a graphing calculator, such as a TI-84 Plus or a TI-Nspire, for class. A free online AP Statistics calculator does the same core work in a browser. It helps when a graphing calculator is not nearby, or when a student wants a clear result and chart at the same time. The goal is to remove the arithmetic bottleneck so students can focus on setup, conditions, and meaning.
What an AP Statistics Calculator Calculates
A good AP Statistics calculator covers the main course topics. These are the tools students use most often.
Normal Distribution
A normal distribution calculator finds the probability that a value falls in a range, or finds a value for a given percentile, using the mean and standard deviation. For example, with a mean of 75 and a standard deviation of 8, it can find the probability that a score falls between 70 and 85. This matches normalcdf and invNorm.
Binomial Probability
A binomial probability calculator finds the chance of a fixed number of successes in a fixed number of trials, when each trial has the same probability of success. If a student guesses on 10 questions, each with a 25 percent chance of being right, it can find the probability of getting exactly 4 right, or at most 4 right. This matches binompdf and binomcdf.
T-Test
A t-test compares a sample mean to a claimed value, or compares two sample means, when the population standard deviation is unknown. It uses the sample mean, sample standard deviation, sample size, and degrees of freedom to find the test statistic and p-value.
Chi-Square Test
A chi-square test checks counts in categories: goodness-of-fit, independence, and homogeneity. The calculator finds the expected counts and reports the chi-square statistic, degrees of freedom, and p-value.
Confidence Interval
A confidence interval gives a range of plausible values for a population mean or proportion. The calculator uses the sample result, the standard error, and the critical value for the chosen confidence level. A 95 percent interval is the most common choice. It is a range built by a method that works 95 percent of the time in repeated sampling.
P-Value and Z-Score
A p-value is the probability of getting a result at least as extreme as the observed result, if the null hypothesis is true. A small p-value is evidence against the null hypothesis. A z-score tells how many standard deviations a value is from the mean. A z-score of 2 means the value is two standard deviations above the mean.
Regression Analysis
Regression analysis describes the relationship between two quantitative variables. The calculator finds the least-squares regression line, slope, intercept, correlation, and predicted values. It can also draw a scatter plot with the regression line, so students can see whether a linear model fits.
How to Use an AP Statistics Calculator Step by Step
Good calculator use starts before any number is typed:
- Name the procedure. Is it a probability, a confidence interval, or a hypothesis test? That answer picks the right tool.
- List what is given. Write down the mean, standard deviation, sample size, sample mean, counts, or data values.
- Pick the tool. Choose normal distribution, binomial probability, t-test, chi-square test, confidence interval, or regression.
- Enter the values carefully. A single wrong decimal, or a swapped lower and upper bound, changes the answer.
- Read the full result. Look at the test statistic, p-value, degrees of freedom, and interval bounds, not just the first number.
- Write the conclusion in context. State the answer in terms of the problem, not just as a number.
AP Statistics grading rewards setup and interpretation, not only the final number.
When to Use It for Homework vs Exam Prep
For homework, use a calculator as a checking tool. Try the problem by hand first when the teacher asks for hand work, then confirm the result. If the answers differ, find the mistake instead of copying the calculator answer.
For exam prep, practice under timed conditions. The AP Statistics exam has multiple-choice and free-response sections, and both reward fast, accurate setup. Practice finding a p-value, building a confidence interval, and reading regression output. Also practice the parts where a calculator does not help: stating conditions, checking the model, and writing a clear conclusion.
On the real exam, the College Board allows approved graphing calculators, including the TI-84 Plus and the non-CAS TI-Nspire. Practice with that calculator too, not only the online one.
Common Mistakes to Avoid
The most common mistakes are setup errors, not arithmetic errors:
- Wrong distribution. Check whether the problem describes a normal distribution, a binomial setting, or a sample mean.
- Standard deviation vs standard error. The standard error is the spread of a sampling distribution, and it is smaller when the sample is larger.
- Wrong degrees of freedom. For a one-sample t-test, the degrees of freedom are the sample size minus one.
- Reading a p-value backwards. A p-value is not the probability that the null hypothesis is true.
- Skipping the conditions. If random sampling, independence, and sample size conditions are not met, the p-value and interval may not be valid.
- No context. A confidence interval, p-value, or regression slope only earns full credit when it is explained.
Frequently Asked Questions
What is an AP Statistics calculator?
It performs the calculations taught in AP Statistics: normal distribution, binomial probability, t-tests, chi-square tests, confidence intervals, z-scores, and regression. It helps students check work and study for the exam.
Is an AP Statistics calculator free to use?
Yes. The Ap Stats Calculator is free, runs in a web browser, and does not require a login. Students can use it on a desktop, laptop, tablet, or phone.
Can I use an online calculator on the AP Statistics exam?
No, not as a replacement for an approved graphing calculator. The College Board sets the exam-day rules, so check them. Use the online calculator for practice, and an approved calculator such as a TI-84 Plus for the exam.
Does a calculator do the whole AP Statistics problem?
No. A calculator handles the arithmetic, but it does not choose the procedure, check the conditions, or write the conclusion. Those steps are part of statistical inference.
Try the Free Ap Stats Calculator
An AP Statistics calculator saves time, but its real value is the time it gives back for thinking. Use it to check homework, practice exam problems, and build confidence with normal distribution, binomial probability, hypothesis testing, and regression.
Try the free Ap Stats Calculator now at www.apstatscalculator.com. Pick a tool, enter your numbers, and check your answer in seconds.
Disclaimer: AP is a trademark of the College Board, which was not involved in the production of this site.