AP Statistics Formula Sheet Explained
Your AP Statistics formula sheet explained: descriptive statistics, probability, sampling distributions, and inference formulas for exam day success now.
Ap Stats Calculator
Ap Stats Calculator
On AP Statistics exam day, you get a formula sheet. That is good news, because you do not need to memorise every formula. It is also a trap, because a formula you have never used before will not help under time pressure, even if it is printed in front of you.
This guide explains the formulas in plain language, grouped by topic, and shows how each group connects to a calculator function you will actually use.
How the Formula Sheet Is Organised
The sheet has four main groups: descriptive statistics, probability, sampling distributions, and statistical inference. Descriptive statistics summarises data you already have. Probability describes chance for a single experiment. Sampling distributions describe what happens when you take many samples. Inference uses a sample to make a claim about a population, through a confidence interval or a hypothesis test.
When you open a question, first ask which group it belongs to. Data summary means descriptive statistics, chance means probability, many samples means sampling distributions, and learning about a population from a sample means inference. That tells you which part of the sheet to use and which calculator menu to open.
Descriptive Statistics Formulas
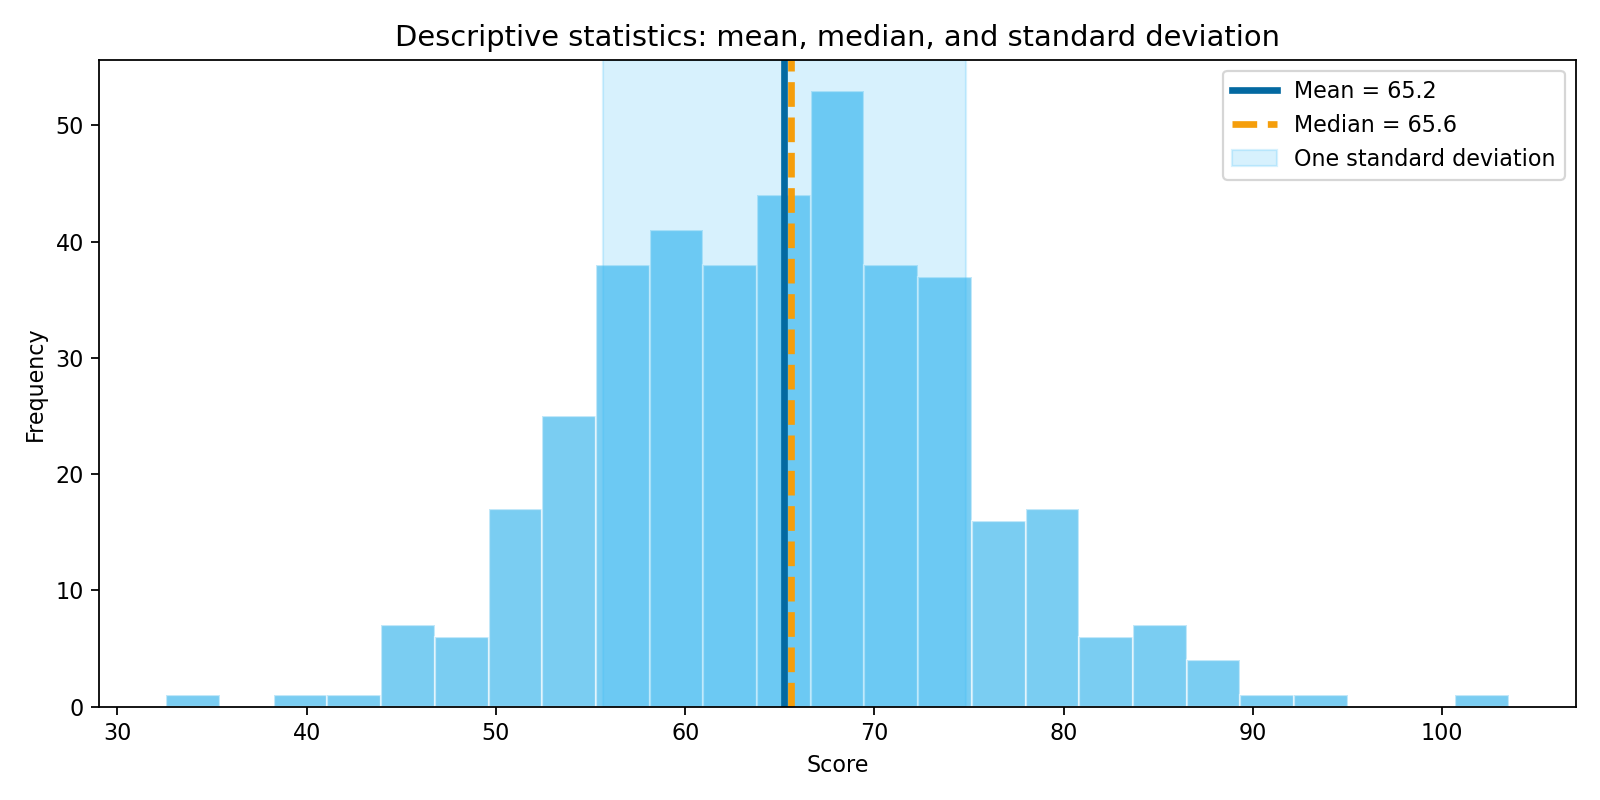
Descriptive statistics starts with the mean, written as x-bar for a sample: add all values and divide by how many there are. The median is the middle value when data are ordered, and it is less affected by outliers than the mean. Standard deviation measures spread, or how far values typically fall from the mean.
For a sample, the standard deviation uses n minus 1 in the denominator, where n is the sample size, giving the sample standard deviation, written as s. For a whole population, the denominator is N, giving the population standard deviation, written as sigma. On the TI-84 Plus, both appear in 1-Var Stats.
The z-score is also in this group: z equals x minus the mean, divided by the standard deviation. It tells you how many standard deviations a value sits above or below the mean, and it is the bridge to the normal distribution, because once you have a z-score you can find a probability with normalcdf.
Probability Formulas
Probability covers addition and multiplication rules for events, conditional probability, and the mean and variance of a discrete random variable. Two distributions deserve special attention.
The binomial distribution applies when you have a fixed number of independent trials, each with the same probability of success, and you count successes. Its mean is n times p, and its standard deviation is the square root of n times p times one minus p. On a calculator, binompdf gives the probability of exactly x successes, and binomcdf gives the probability of x or fewer successes.
The geometric distribution applies when you count trials until the first success, and its mean is one divided by p. Counting successes in a fixed number of trials is binomial, while waiting for the first success is geometric, so read the question carefully.
The normal distribution is the most used probability model in AP Statistics. If a variable is normal with mean mu and standard deviation sigma, the probability between two values comes from normalcdf, and the value at a given percentile comes from invNorm. Those two functions, plus the z-score formula, cover a large share of probability questions.
Sampling Distribution Formulas
Sampling distributions describe how a statistic, such as a sample mean or sample proportion, varies from sample to sample. For a sample mean, the mean of the sampling distribution equals the population mean, and its standard deviation, called the standard error, equals the population standard deviation divided by the square root of n. As n grows, the standard error shrinks, which is why larger samples give more precise estimates.
The central limit theorem says that for a large enough sample, the sampling distribution of the mean is approximately normal, even if the population is not normal. For a sample proportion, the mean of the sampling distribution equals the population proportion p, and the standard error equals the square root of p times one minus p, divided by n.
Inference Formulas: Confidence Intervals and Hypothesis Tests
Inference follows one pattern again and again. A confidence interval is an estimate plus or minus a margin of error, where the margin of error is a critical value, usually a z-score or t-score, multiplied by the standard error. Hypothesis testing uses a test statistic, which is the estimate minus the claimed value, divided by the standard error, and the p-value is the probability of a result at least as extreme as the one observed, assuming the null hypothesis is true.
For a single mean with a known population standard deviation, use a z-interval or z-test. In practice the population standard deviation is rarely known, so AP Statistics usually uses a t-interval or t-test for hypothesis testing, with degrees of freedom equal to n minus 1. For a single proportion, use a z-interval or z-test, with the standard error based on the sample proportion for intervals and on the claimed proportion for tests.
For two samples, estimate the difference and use its standard error with the appropriate critical value. For chi-square tests, the test statistic sums the squared differences between observed and expected counts, divided by expected counts. On the TI-84 Plus, these calculations live under STAT, then TESTS: T-Test, 2-SampTTest, 1-PropZTest, TInterval, and the chi-square test each ask for the same inputs the formula sheet shows.
Frequently Asked Questions
Do I get a formula sheet on the AP Statistics exam?
Yes. The College Board provides a formula sheet and tables on exam day, so practise with it beforehand.
Do I need to memorise all the AP Statistics formulas?
No, but you need to know what each formula means and when it applies. The sheet gives you the symbols, while your understanding tells you which formula fits the question.
Which calculator functions match the formula sheet?
Normalcdf and invNorm match normal distribution work, binompdf and binomcdf match binomial probability, T-Test and 2-SampTTest match mean inference, chi-square tests match categorical data, and LinRegTTest matches regression inference on the TI-84 Plus and TI-Nspire.
What is the difference between standard deviation and standard error?
Standard deviation describes spread in a single set of data or in a population. Standard error describes spread in a sampling distribution, or how much a statistic varies from sample to sample. Sampling formulas divide by the square root of n for exactly this reason.
Conclusion
The AP Statistics formula sheet is a tool, not a substitute for understanding. Learn the four groups, connect each formula to a calculator function, and practise with the sheet until choosing the right formula feels automatic. Then, on exam day, you can spend your time on reasoning and interpretation.
Try the free Ap Stats Calculator at www.apstatscalculator.com to practise normal distribution, binomial probability, t-test, chi-square test, confidence interval, and regression calculations alongside the formulas on your sheet.
AP is a trademark of the College Board, which was not involved in the production of this site.