AP Stats TI-84 Calculator Guide
Step-by-step TI-84 guide for AP Statistics: normalcdf, invNorm, binompdf, T-Test, chi-square test, regression, and confidence intervals explained simply.
Ap Stats Calculator
Ap Stats Calculator
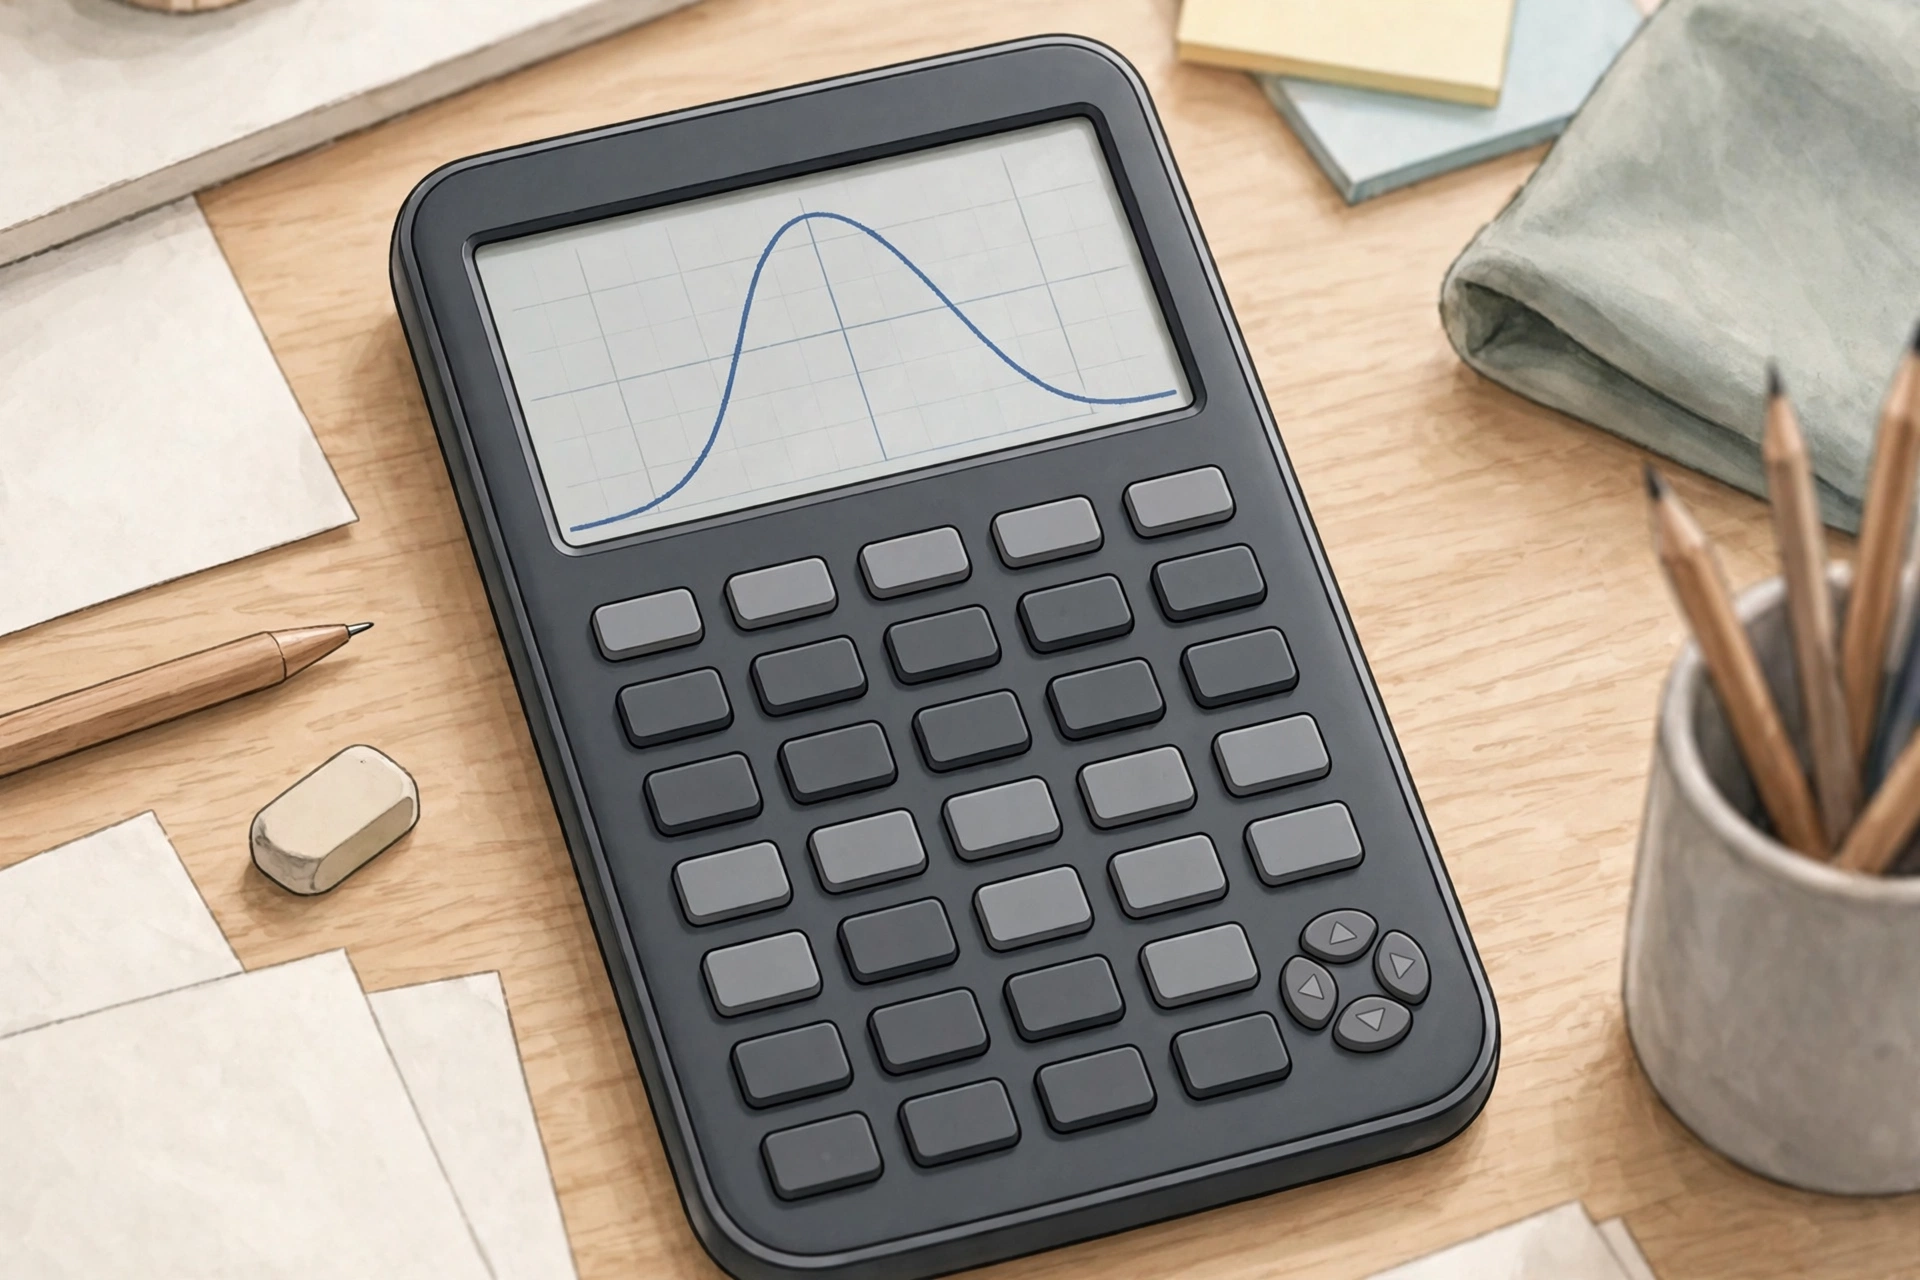
A TI-84 Plus or TI-84 Plus CE can save you time on the AP Statistics exam, but only if you know which menu to open and what each input means. This guide covers the TI-84 menus AP Statistics students need, with button steps for homework and exam day.
Before You Start: Clear Lists and Check Settings
Many TI-84 errors come from old data, not bad math. Before a new problem, press STAT, choose ClrList, then press 2nd, 1, 2nd, 2, and ENTER to clear L1 and L2. Then press STAT, choose Edit, and enter your new data.
Normal Distribution: normalcdf and invNorm
The normal distribution appears in almost every AP Statistics unit. Use normalcdf when you know the bounds and want a probability. Use invNorm when you know a probability or percentile and want the value, or its z-score.
normalcdf
Press 2nd DISTR, then choose normalcdf. Enter, in order: lower bound, upper bound, mean, standard deviation. For example, normalcdf(40, 60, 50, 10) is the probability between 40 and 60 for a mean of 50 and a standard deviation of 10. For a left tail use -1E99; for a right tail use 1E99.
invNorm
Press 2nd DISTR, then choose invNorm. Enter the area to the left, then the mean, then the standard deviation: invNorm(0.90, 50, 10) gives the 90th percentile above. invNorm always uses the left-tail area, so subtract a right-tail area from 1 first.
Binomial Probability: binompdf and binomcdf
Use it when each trial has two outcomes, trials are independent, and the probability of success stays the same.
Press 2nd DISTR, then choose binompdf for exactly x successes: binompdf(n, p, x). Choose binomcdf for at most x successes: binomcdf(n, p, x). For at least x successes, use 1 - binomcdf(n, p, x - 1). For example, at least 7 successes out of 10 is 1 - binomcdf(10, p, 6).
Data Summaries: 1-Var Stats and 2-Var Stats
For a list of data, press STAT, move right to CALC, and choose 1-Var Stats. Enter your list, such as L1, and press ENTER to see the mean, standard deviation, quartiles, and five-number summary. Note two standard deviations: Sx is the sample standard deviation, and the symbol below it is the population standard deviation. AP Statistics almost always uses Sx. For two variables, use 2-Var Stats for each mean, each standard deviation, and the correlation.
Hypothesis Tests: T-Test and 2-SampTTest
Most AP Statistics tests live under STAT TESTS.
Use a one-sample T-Test for a claim about one population mean when the population standard deviation is unknown. Press STAT TESTS and choose T-Test. Choose Stats for summary numbers or Data for raw values in a list. Enter the claimed mean, sample statistics, and test direction, then press Calculate. A small p-value, compared with the significance level, is evidence against the null hypothesis.
Use 2-SampTTest to compare two independent groups. Enter both samples, choose the direction, and set Pooled to No unless the question states otherwise. The output gives the test statistic, degrees of freedom, and p-value.
Chi-Square Test
A chi-square test checks counts in categories, not means. For goodness of fit, enter observed counts in L1 and expected counts in L2, then press STAT TESTS and choose Chi2GOF-Test, with degrees of freedom equal to categories minus 1. For a two-way table, enter observed counts in a matrix (2nd, then x^-1 for MATRIX, then Edit), then choose Chi2-Test. Check first that all expected counts are at least 5.
Regression Analysis: LinRegTTest and Confidence Intervals
In regression analysis, enter the explanatory variable in L1 and the response variable in L2. Press STAT TESTS and choose LinRegTTest, with L1 as Xlist and L2 as Ylist. The output gives the slope, intercept, test statistic, and p-value. Use the p-value to judge whether the slope differs from zero.
For confidence intervals, also use STAT TESTS. Use TInterval for a mean when the population standard deviation is unknown, the usual case. Use ZInterval for a mean only when that standard deviation is known, or for a proportion with the correct z procedure. Enter the sample information and the confidence level, such as 0.95, and press Calculate.
Common TI-84 Mistakes to Avoid
- Wrong degrees of freedom. One-sample t uses n minus 1; chi-square goodness of fit uses categories minus 1; for two samples, let the calculator find them.
- Forgetting to clear lists. Old data can change a mean, test, or regression line without warning.
- Using the population standard deviation. On 1-Var Stats, use Sx for a sample.
- Entering the wrong area in invNorm. invNorm uses the left-tail area, so convert right-tail areas first.
- Forgetting the test direction. One-sided and two-sided tests give different p-values.
- Copying the wrong output line. Label the test statistic, p-value, and degrees of freedom first.
Shortcuts and Programs
Press 2nd QUIT to leave a menu quickly, and 2nd ENTRY to recall and edit your last entry instead of retyping it. Store a repeated value with STO. Remember the three menus you will use most: 2nd DISTR, STAT CALC, and STAT TESTS. TI-84 programs only help if you understand what they calculate, so on the exam, name the procedure and show your work.
Frequently Asked Questions
Which TI-84 should I buy for AP Statistics?
The TI-84 Plus CE is the best choice for most students: color screen, rechargeable battery, and the same menus as the TI-84 Plus. Avoid a TI-Nspire CAS, because computer algebra systems are restricted on the exam.
Is the TI-84 allowed on the AP Statistics exam?
Yes. The College Board allows a graphing calculator, including the TI-84 Plus and TI-84 Plus CE, on the AP Statistics exam. Bring a charged calculator.
Why does my normalcdf answer look wrong?
Check the input order: lower bound, upper bound, mean, standard deviation. Check that you used the standard deviation, not the variance. An answer outside 0 to 1 means an input is wrong.
Should I use Stats or Data in a test menu?
Use Stats when the question gives summary numbers. Use Data when the raw values are already in a list. Both run the same test, but Stats saves time.
Conclusion
Learn these menus in order: normalcdf and invNorm, binompdf and binomcdf, 1-Var Stats, T-Test and 2-SampTTest, chi-square test, and LinRegTTest plus TInterval and ZInterval. Practice each one and clear your lists before each new problem.
Want to check your answer? Run the same calculation with the free Ap Stats Calculator at www.apstatscalculator.com and compare the probability, test statistic, p-value, or interval. If they differ, recheck your lists, standard deviation, and degrees of freedom first.
Disclaimer: AP is a trademark of the College Board, which was not involved in the production of this site.