Chi-Square Test Calculator Guide
Learn chi-square tests step by step: goodness of fit, independence, and homogeneity, expected counts, degrees of freedom, p-value, and worked examples.
Ap Stats Calculator
Ap Stats Calculator
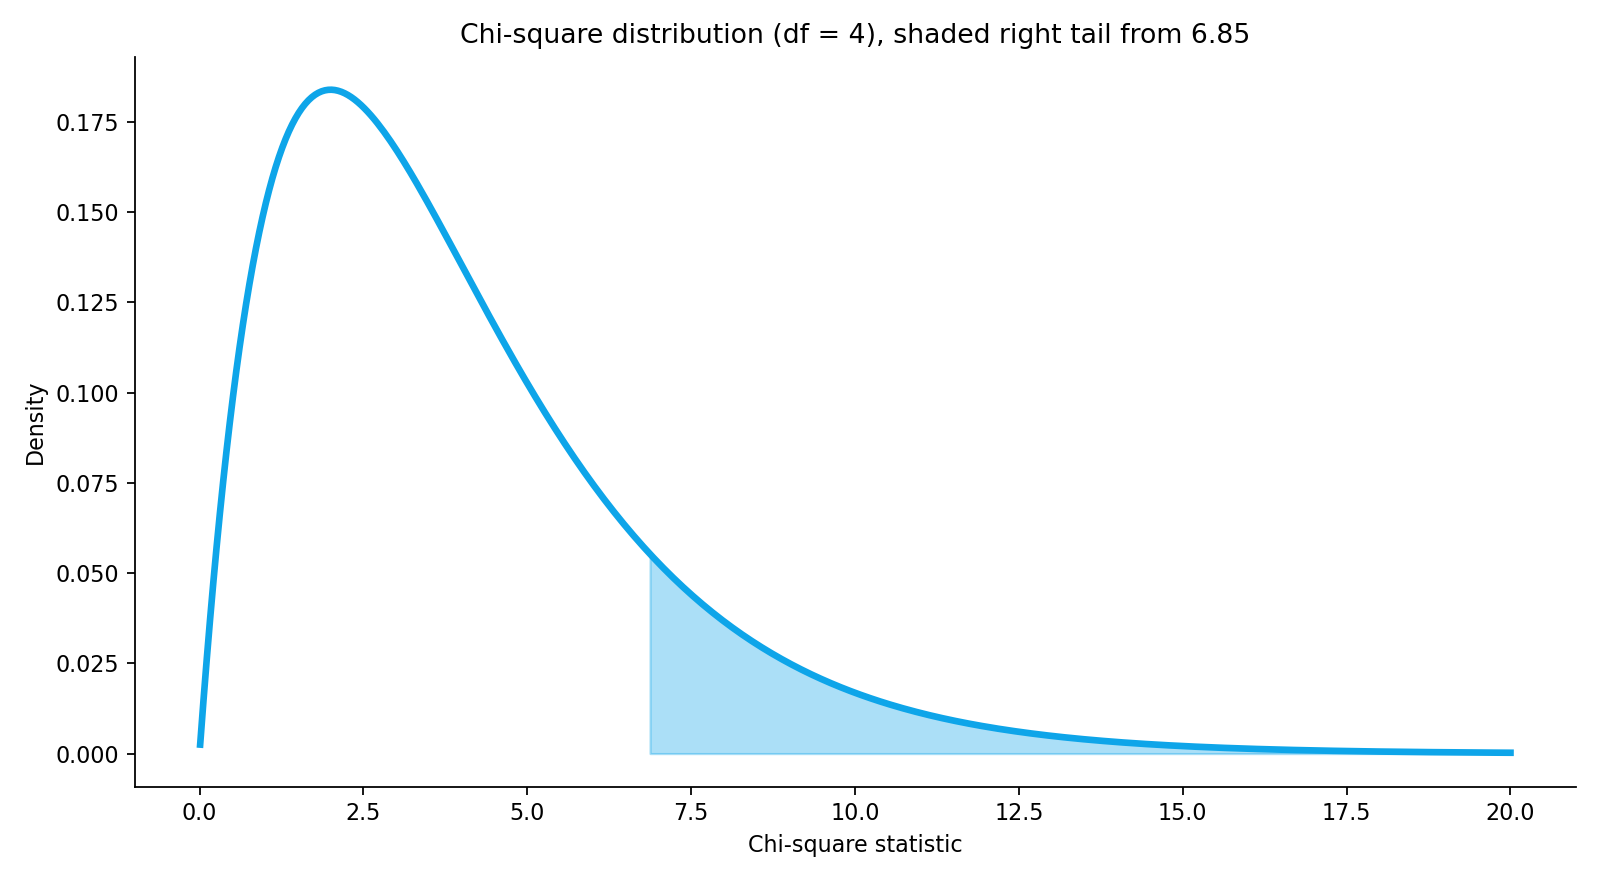
A chi-square test is the AP Statistics tool for categorical data. While t-tests and z-tests deal with means and proportions, chi-square tests deal with counts in categories. They ask whether observed counts match what a model predicts, or whether two categorical variables are related. There are three chi-square tests in the course: goodness of fit, independence, and homogeneity. They share the same test statistic and the same chi-square distribution, but they answer different questions, and choosing the wrong one is a common exam error.
What Is a Chi-Square Test?
The chi-square test statistic compares observed counts with expected counts. For each cell or category, you calculate the observed count minus the expected count, square that difference, and divide by the expected count. Then you add those values across all cells. In symbols, chi-square equals the sum of (observed minus expected) squared divided by expected. A large value means the observed counts are far from the expected counts, which gives a small p-value.
The chi-square distribution is not symmetric. The p-value is always the area to the right of the test statistic, because only large values count as evidence against the null hypothesis.
Goodness of Fit: Does One Variable Match a Model?
A goodness-of-fit test checks whether the distribution of one categorical variable matches a claimed model. For example, a die maker claims a die is fair, so each face should appear one sixth of the time. You roll the die 120 times and count how often each face appears. The null hypothesis is that the claimed proportions are correct. The alternative is that at least one proportion differs.
The expected count for a category is the total number of observations times the claimed proportion for that category. The degrees of freedom are the number of categories minus one. If there are six faces, the degrees of freedom are five. On a TI-84 Plus, goodness of fit is done by entering observed counts in one list and expected counts in another, then using the chi-square goodness-of-fit test in the STAT TESTS menu, or by calculating the statistic by hand from the lists.
Test of Independence: Are Two Variables Related?
A test of independence uses data from one sample, classified by two categorical variables, shown in a two-way table. For example, one sample of students is classified by gender and by whether they prefer maths or English. The null hypothesis is that the two variables are independent, meaning no association between them. The alternative is that they are not independent, meaning there is an association.
Expected counts are calculated from the row and column totals: the row total times the column total, divided by the grand total. The degrees of freedom are the number of rows minus one, times the number of columns minus one. For a two-by-two table, that is one degree of freedom. On a TI-84 Plus, enter the observed counts as a matrix, then use the chi-square test in STAT TESTS, which calculates the expected counts and the test statistic for you.
Test of Homogeneity: Do Groups Differ?
A test of homogeneity looks similar, because it also uses a two-way table and the same calculation, but the design is different. Here, separate samples are taken from different populations, and the distribution of a categorical variable is compared across those populations. For example, samples of students from three schools are asked which subject they prefer. The null hypothesis is that the distribution of preferences is the same in all populations. The alternative is that at least one population differs.
Conditions for Chi-Square Tests
Two main conditions must be checked. First, random sampling, or random assignment where relevant, and the 10% condition for sampling without replacement. Second, all expected counts must be large enough. The AP Statistics guideline is that all expected counts should be at least five. If an expected count is too small, categories can sometimes be combined, but that changes the question and the degrees of freedom, so it should be done with care and explained.
Worked Example: Goodness of Fit
A spinner is claimed to land on red 50% of the time, blue 30%, and green 20%. In 200 spins, the observed counts are red 90, blue 70, and green 40. The expected counts are red 100, blue 60, and green 40. The chi-square statistic is (90 minus 100) squared divided by 100, plus (70 minus 60) squared divided by 60, plus (40 minus 40) squared divided by 40, which equals 1 plus 1.67 plus 0, or about 2.67. With three categories, the degrees of freedom are two, and the p-value is about 0.264. There is not convincing evidence that the spinner differs from the claimed model. The blue count looks high, but with this sample size, it could reasonably be due to chance.
Common Mistakes to Avoid
The most common mistake is choosing the wrong test: goodness of fit for one variable, independence for one sample with two variables, and homogeneity for separate samples. The second mistake is using a two-sided p-value, or doubling the p-value, when chi-square is always right-tailed. The third is entering percentages instead of counts. The fourth is forgetting to check expected counts. The fifth is claiming causation from an association. Each of these errors can cost marks even if the arithmetic is correct.
Frequently Asked Questions
What is the difference between independence and homogeneity?
Independence uses one sample classified by two variables and asks whether they are associated. Homogeneity uses separate samples from different populations and asks whether the distribution of one variable is the same across those populations. The calculation is the same, but the design and the hypotheses differ.
Why is a chi-square test always right-tailed?
Only large values of the chi-square statistic count as evidence against the null hypothesis, because the statistic measures distance between observed and expected counts. Small values mean a close match. The p-value is therefore always the area to the right.
How many degrees of freedom does a goodness-of-fit test have?
The degrees of freedom are the number of categories minus one. For a two-way table, the degrees of freedom are the number of rows minus one, times the number of columns minus one.
What if an expected count is less than five?
The chi-square conditions are not met. Categories may sometimes be combined, but that changes the test and must be explained. Do not simply ignore a small expected count and report the p-value as if the conditions held.
Conclusion
Chi-square tests turn categorical counts into a clear argument: calculate expected counts, find the test statistic, check the conditions, and interpret the p-value in context, remembering that association is not causation. The hardest part is usually choosing between goodness of fit, independence, and homogeneity, so always start by describing the design. Try the free Ap Stats Calculator at www.apstatscalculator.com to practise chi-square tests, check your expected counts and p-value, and prepare for the AP Statistics exam.
AP is a trademark of the College Board, which was not involved in the production of this site.