Confidence Interval Calculator Guide
Learn how to build and interpret confidence intervals with the free Ap Stats Calculator, covering z-intervals, t-intervals, margin of error, and examples.
Ap Stats Calculator
Ap Stats Calculator
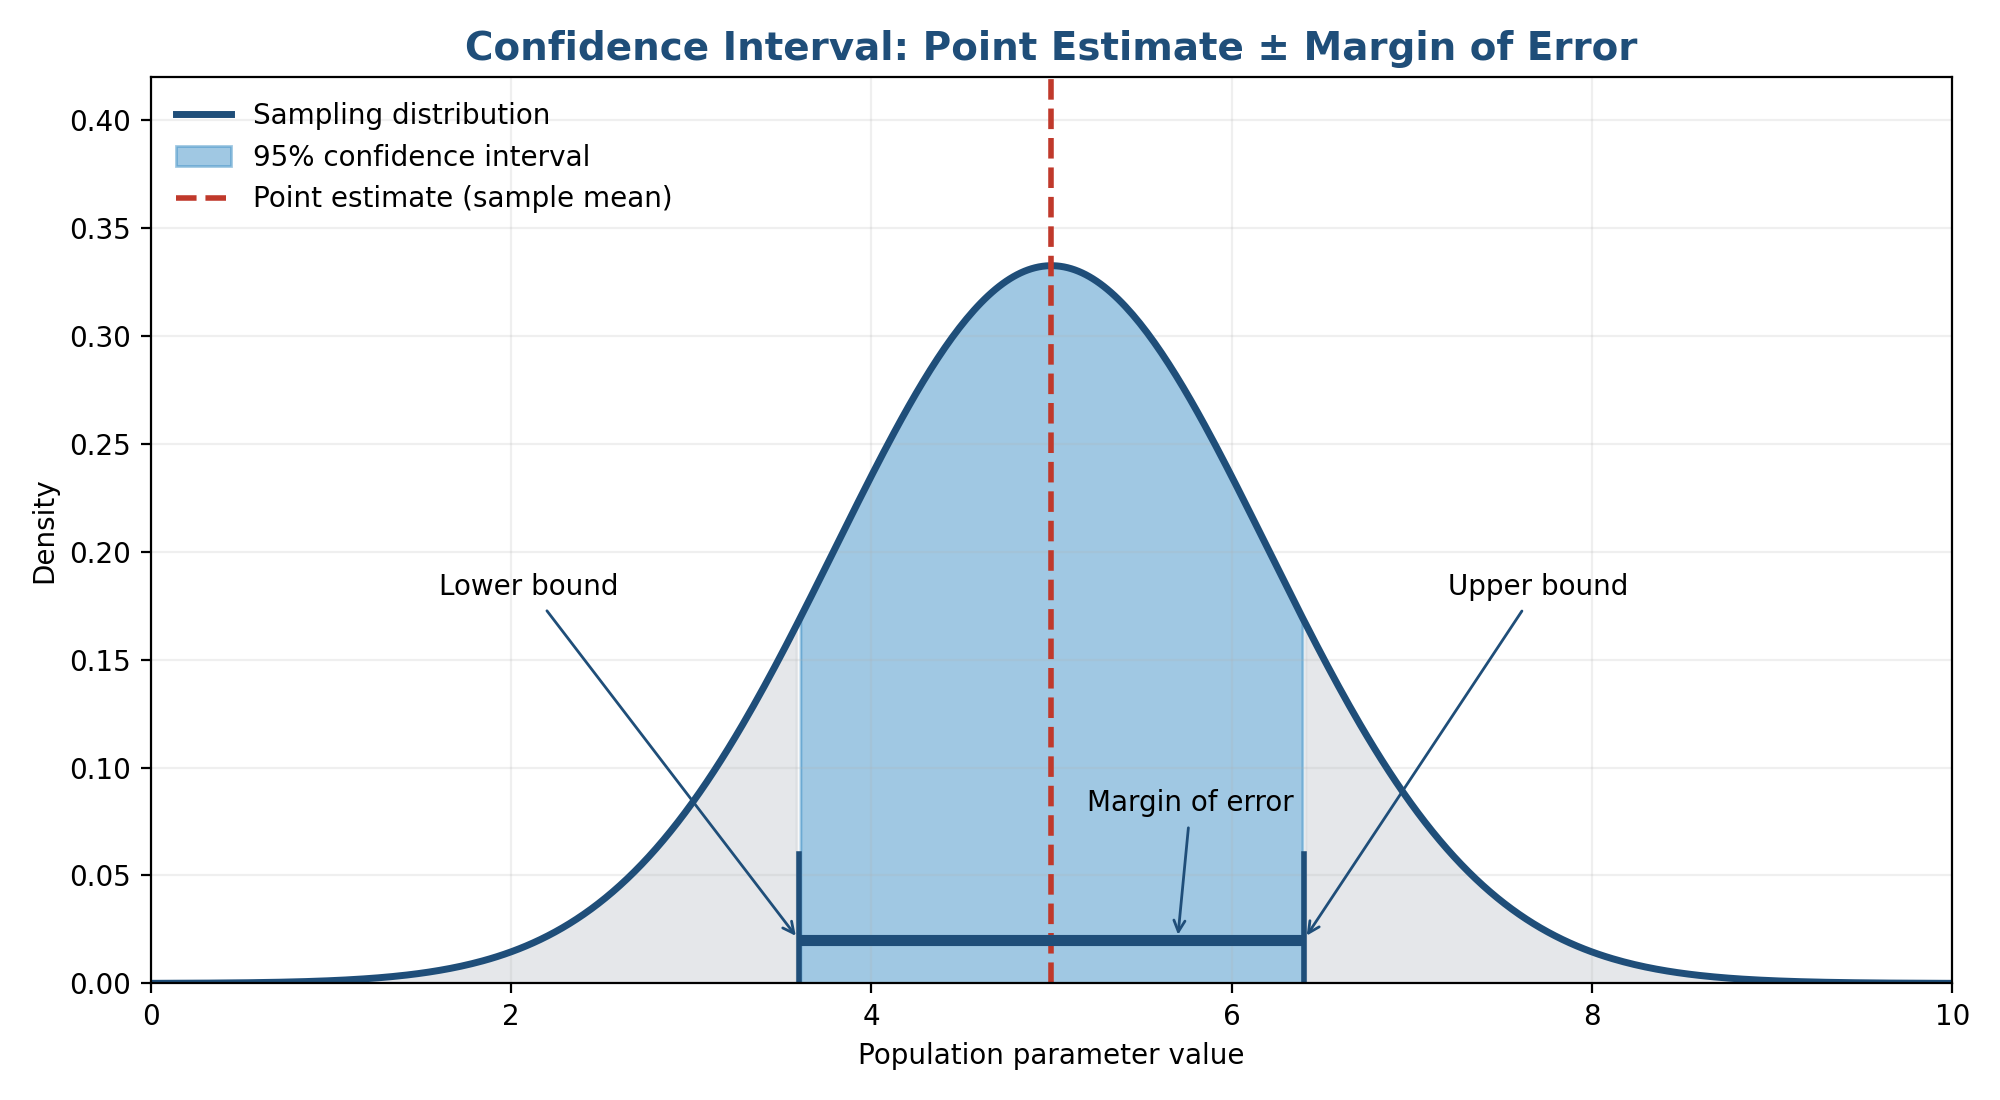
How sure can you be about a survey result? A confidence interval turns one sample statistic into a range of plausible values for the true population value. This guide covers z-intervals, t-intervals, and conditions.
What Is a Confidence Interval?
A confidence interval is a range, built from sample data, likely to contain an unknown population parameter. If a sample proportion is 0.62, the true proportion could be a little higher or lower, so a 95% interval such as (0.58, 0.66) shows the values consistent with the data.
Every interval has two parts: a point estimate, such as a sample proportion or sample mean, and a margin of error: point estimate ± margin of error. A higher confidence level gives a wider interval. Intervals are a core part of statistical inference; unlike a hypothesis test, which often reports a p-value, an interval shows a range of plausible values.
Z-Interval vs T-Interval: When to Use Each
Use a z-interval for a population proportion, or for a mean when the population standard deviation is known. It uses a critical value, z*, from the standard normal distribution; for 95% confidence, z* is about 1.96. A one-proportion z-interval suits yes-or-no data, such as the share of students who prefer online homework.
Use a t-interval for a mean when the population standard deviation is unknown, the usual case. You estimate it from the sample, and the t-distribution accounts for that extra uncertainty. Its critical value, t*, depends on the confidence level and degrees of freedom (sample size minus one); with a small sample, t* exceeds z*, so the interval is wider.
In short: proportions use z, means with an unknown standard deviation use t. On a TI-84 Plus or a TI-Nspire, these are 1-PropZInt and TInterval.
Understanding Margin of Error
The margin of error is how far the interval extends either side of the point estimate: the critical value multiplied by the standard error. For a proportion, the standard error depends on the sample proportion and size; for a mean, on the sample standard deviation and size.
Three factors control its size: larger samples give smaller margins (quadrupling sample size roughly halves it); higher confidence needs a wider interval; and more spread, shown by a larger standard deviation, gives a larger margin. Hence polls often report a margin near three percentage points.
How to Interpret a Confidence Interval Correctly
Suppose a 95% interval for mean weekly study time is (6.2, 7.8) hours. Correctly: “We are 95% confident that the interval from 6.2 to 7.8 hours captures the true mean study time for all high school students.”
It does not mean a 95% probability that the true mean falls in this one interval; once calculated, it is either inside or not. The 95% refers to the method: over many repeated samples, about 95% of intervals would capture the true value. Nor does it mean 95% of individual students fall in the interval: an interval is about a parameter, not individuals.
Conditions: Random, Normal, and Independence
Check three conditions first; if they fail, the interval may not be trustworthy, even if the arithmetic is correct.
Random: Data must come from a random sample or randomized experiment; asking only your friends does not let you generalize to the population.
Normal: The sampling distribution must be approximately normal. For a proportion, successes and failures should both be at least 10; for a mean, the sample should be large (usually at least 30) or the population roughly normal.
Independence: Observations must be independent, and the sample should be no more than 10% of the population when sampling without replacement. State and check each condition before reporting the interval.
Worked Example 1: One Proportion
A school surveys 200 randomly selected students; 130 say they use a calculator app for homework. Find a 95% interval for the true proportion of all students at the school who use one.
The sample proportion is 130/200, or 0.65. Conditions are met: the sample is random, counts are 130 successes and 70 failures (both above 10), and random sampling supports independence. With a one-proportion z-interval (z* = 1.96), the standard error is about 0.034, the margin of error about 0.066, and the interval roughly (0.584, 0.716).
Interpretation: We are 95% confident that 0.584 to 0.716 captures the true proportion of all students at the school who use a calculator app.
Worked Example 2: One Mean
A teacher collects test scores from 25 randomly selected students, with a sample mean of 78 points and a sample standard deviation of 9 points. Find a 90% interval for the true mean score.
Because the population standard deviation is unknown, use a one-sample t-interval. Degrees of freedom are 24, t* for 90% confidence is about 1.711, the standard error is 9/√25 = 1.8, and the margin of error is about 3.08. The interval is roughly (74.9, 81.1).
Interpretation: We are 90% confident that 74.9 to 81.1 points captures the true mean test score. The t-interval is wider than a z-interval would be here, because the small sample adds uncertainty.
Common Mistakes to Avoid
- Using z instead of t for a mean with an unknown standard deviation. This gives an interval that is too narrow.
- Forgetting to check conditions. An unchecked interval is incomplete on an AP question.
- Treating the interval as a probability about one interval. The confidence level describes the method over many samples, not one interval.
- Confusing the sample mean with the population mean. The interval estimates the population value.
- Rounding too early. Keep extra digits, and round only at the end.
- Mixing up standard deviation and standard error. The first is spread in the data; the second is variation of a sample statistic across samples.
If an interval looks far too wide or narrow, check the sample size and critical value.
FAQ
What is a confidence interval in simple terms?
A range of plausible values for a population parameter, built from sample data: a point estimate plus a margin of error.
Should I use a z-interval or a t-interval?
Use a z-interval for a proportion, or for a mean with a known population standard deviation. Use a t-interval for a mean when it is unknown, the usual case.
What does a 95% confidence level really mean?
Over many repeated samples, about 95% of intervals built this way would contain the true parameter — not a 95% chance for one specific interval.
How can a confidence interval calculator help on the AP Statistics exam?
It checks your arithmetic and applies the correct critical value, letting you focus on procedure, conditions, and interpretation. Always show your work, even when a calculator computes the interval.
Conclusion
Confidence intervals turn a single sample result into an honest range of plausible values. Choose the right procedure, check the conditions, and interpret the result.
Try the free Ap Stats Calculator at www.apstatscalculator.com to build your own confidence intervals.
Disclaimer: AP is a trademark of the College Board, which was not involved in the production of this site.