Descriptive Statistics Calculator Guide: Mean, Median, Standard Deviation and IQR
Learn how a descriptive statistics calculator finds the mean, median, quartiles, IQR and outliers, with a worked 1-Var Stats example for AP Statistics students.
Ap Stats Calculator
Ap Stats Calculator
Descriptive statistics describe a data set in a few clear numbers: its centre, its spread, and any values that stand apart. They form the foundation for statistical inference, confidence intervals, and hypothesis testing. A descriptive statistics calculator handles the arithmetic, so you can focus on choosing the right summary and explaining it.
What Is 1-Var Stats?
1-Var Stats is the one-variable statistics routine on a graphing calculator. Enter one list of numbers and it returns the sample size, mean, standard deviation, minimum, first quartile, median, third quartile, and maximum. On a TI-84 Plus it sits under the STAT menu; a TI-Nspire offers the same summary, and an online calculator gives the same output in a browser.
It describes one quantitative variable only — not a comparison of groups or a test of a claim. It answers a simpler question first: what does this batch of numbers look like?
The Mean and the Sample Mean
The mean is the arithmetic average: add all the values and divide by how many there are. The mean of a sample, often written as x-bar, is called the sample mean.
The mean uses every value, so one very large or small value can pull it away from the bulk of the values. Pair it with a measure of spread and a check for unusual values. A calculator usually reports two standard deviations: the sample standard deviation, labelled Sx on a TI-84 Plus, which divides by n − 1, and the population standard deviation, labelled σx, which divides by n.
The Median: The Middle Value
The median is the middle value when the data are sorted from smallest to largest. With an odd number of values, it is the middle one. With an even number, it is the average of the two middle values. Half the data lie below it and half above it.
The median is resistant to outliers: changing the largest value from 91 to 991 would move the mean a great deal, but the median would barely move. So it is often the better centre for skewed distributions, where one tail stretches much farther than the other. If a distribution is roughly symmetric, the mean and median will be close; if it is skewed, report the median and explain why.
Quartiles and the IQR
Quartiles split sorted data into four roughly equal parts. The first quartile, Q1, is the median of the lower half. The third quartile, Q3, is the median of the upper half. The median itself is the second quartile. The interquartile range, or IQR, is the distance between the quartiles:
IQR = Q3 − Q1
It measures the spread of the middle 50 percent of the data. Unlike the range, it ignores the extremes, so it pairs naturally with the median — the usual centre-and-spread pair for a skewed distribution.
Outliers and the 1.5 × IQR Rule
An outlier is a value that lies far from the rest of the data. AP Statistics uses the 1.5 × IQR rule to flag possible outliers:
- Lower fence = Q1 − 1.5 × IQR
- Upper fence = Q3 + 1.5 × IQR
Any value outside these fences is flagged as a possible outlier. The word “possible” matters: it might be a data-entry error or a genuinely unusual case, not necessarily a mistake. Still explain the result — for example, “120 is above the upper fence of 107.5, so it is flagged as a possible outlier.”
Boxplots: Seeing the Five-Number Summary
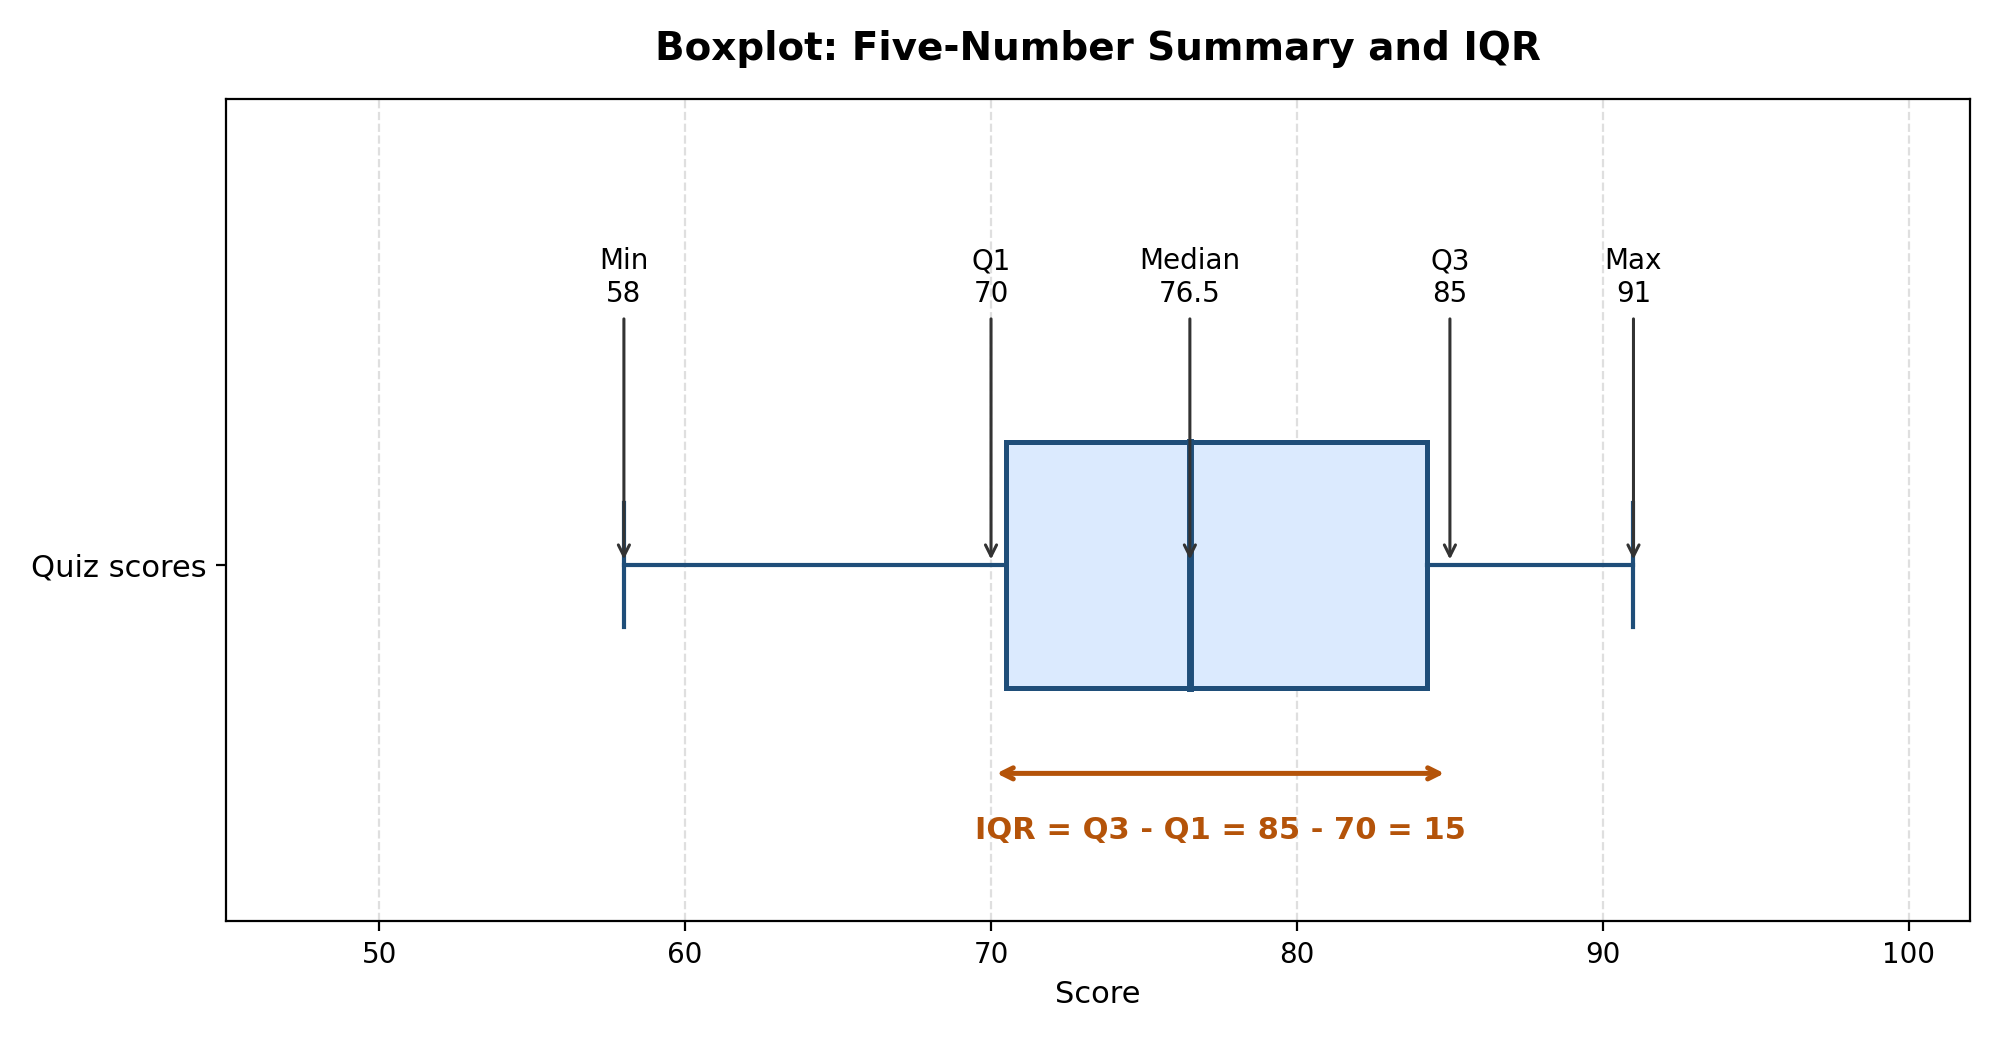
A boxplot, also called a box-and-whisker plot, turns the five-number summary into a picture. The box runs from Q1 to Q3, so its length is the IQR. A line inside the box marks the median. Whiskers extend to the smallest and largest values that are not flagged as outliers, and outliers appear as separate points beyond the whiskers.
Boxplots are ideal for comparing distributions side by side, such as two classes on the same scale. They hide detail, though, so pair them with a dotplot or histogram for gaps and clusters. On a histogram, the mean and median can be marked directly: in a right-skewed histogram, the mean sits to the right of the median, while in a roughly symmetric one, such as a normal distribution, they sit close together.
Worked Example: Ten Quiz Scores
Consider these ten quiz scores, already sorted: 58, 64, 70, 72, 75, 78, 82, 85, 88, 91.
Mean. The total is 763, so the sample mean is 763 ÷ 10 = 76.3.
Median. With ten values, the median is the average of the fifth and sixth values, 75 and 78, which is 76.5.
Quartiles. The lower half is 58, 64, 70, 72, 75, so Q1 is 70. The upper half is 78, 82, 85, 88, 91, so Q3 is 85.
IQR and standard deviation. The IQR is 85 − 70 = 15. The sample standard deviation is about 10.59, so a typical score lies roughly 10.6 points from the mean. The range is 91 − 58 = 33.
Outliers. The lower fence is 70 − 1.5 × 15 = 47.5, and the upper fence is 85 + 1.5 × 15 = 107.5. No score falls outside these fences, so there are no outliers by the 1.5 × IQR rule.
Interpretation. The five-number summary is 58, 70, 76.5, 85, 91. The mean (76.3) and median (76.5) are very close, suggesting a roughly symmetric distribution. Note that descriptive statistics do not use degrees of freedom; that idea enters later, in inference — for example, in a t-test.
Frequently Asked Questions
What does a descriptive statistics calculator do?
It takes a list of numbers and returns the mean, median, quartiles, IQR, standard deviation, range, and five-number summary, often with a boxplot and outlier flags.
Should I use the mean or the median?
Use the mean and standard deviation for roughly symmetric distributions without outliers. Use the median and IQR for skewed distributions or data with outliers, because both resist extreme values.
How do I find the IQR on a TI-84 Plus?
Enter the data in a list, run 1-Var Stats, and read Q1 and Q3 from the output. Subtract: IQR = Q3 − Q1. Then check the fences, Q1 − 1.5 × IQR and Q3 + 1.5 × IQR, for outliers.
Is an outlier always removed from the data?
No. A flagged value is a possible outlier, not automatically an error. Investigate it first, and remove it only for a clear reason, such as a recording mistake.
Conclusion
Descriptive statistics turn a list of numbers into a story: a centre, a spread, a shape, and any values worth a second look.
Try the free Ap Stats Calculator at www.apstatscalculator.com to run 1-Var Stats, find quartiles and IQR, flag outliers, and draw a boxplot for your own data — no login needed.
Disclaimer: AP is a trademark of the College Board, which was not involved in the production of this site.