How to Calculate Your AP Statistics Score
Learn how to calculate your AP Statistics score from your MCQ and FRQ results, with composite score, predicted cutoffs, and a clear worked example for students.
Ap Stats Calculator
Ap Stats Calculator
Your AP Statistics score is a single number from 1 to 5, but it is built from two very different parts of the exam. Once you understand how the multiple choice questions and the free response questions combine, you can estimate your score before results day and see where extra marks would help most.
The AP Statistics Exam Structure
The exam has two sections, each worth 50 percent. Section I is multiple choice: 40 questions in 90 minutes. Section II is free response: 6 questions in 90 minutes, made up of five short-answer questions and one longer investigative task.
A graphing calculator is allowed throughout. The College Board approves models such as the TI-84 Plus, the TI-84 Plus CE, and the TI-Nspire in its non-CAS form. A calculator helps with normal distribution and standard deviation work, binomial probability, t-tests, chi-square tests, confidence intervals, and regression analysis, but it does not replace written explanations. On free response questions, you must show reasoning, state conditions, and interpret results in context.
What Is a Composite Score?
Your results on the two sections are combined into a composite score, a single scale that lets the College Board compare students fairly even when exam forms differ slightly in difficulty. The exact official conversion changes each year, so any score calculator gives a prediction, not an official result.
A common estimate on a 0 to 100 scale gives each section half of the total. For multiple choice, divide your score out of 40 by 40 and multiply by 50. For free response, divide your score out of 75 by 75 and multiply by 50, because the six free response questions together are usually scored out of 75 points. Add the two parts for an estimated composite between 0 and 100.
For example, 30 out of 40 on multiple choice gives 37.5, and 45 out of 75 on free response gives 30, for a composite of 67.5. That formula is the one used by the Ap Stats Calculator score estimator, and it turns practice results into a useful predicted score.
Predicted Score Cutoffs
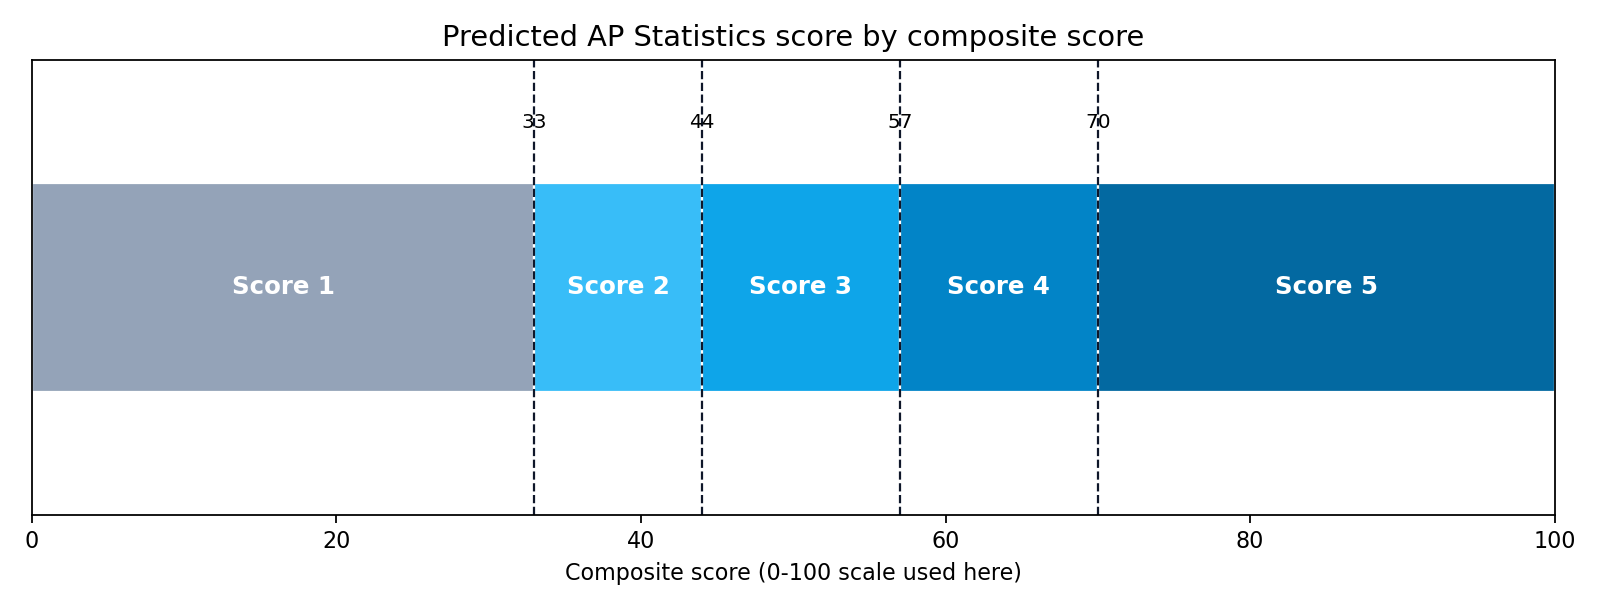
The cutoffs below are predicted cutoffs used by many online score calculators on a 0 to 100 composite scale. They are estimates, not official College Board cutoffs for any single year.
A composite of 70 or higher predicts a score of 5. A composite from 57 to 69 predicts a score of 4. A composite from 44 to 56 predicts a score of 3. A composite from 33 to 43 predicts a score of 2. A composite below 33 predicts a score of 1.
These bands explain why small gains matter. A student at 55 is close to a 4, and a student at 42 is close to a 3. Knowing your band helps you decide whether to work on multiple choice speed, free response writing, or a weak topic such as sampling distributions or inference for proportions.
A Worked Example
Imagine a student scores 28 out of 40 on multiple choice and 50 out of 75 on free response. First, multiple choice: 28 divided by 40 is 0.70, multiplied by 50 gives 35. Next, free response: 50 divided by 75 is about 0.667, multiplied by 50 gives about 33.3. Added together, the estimated composite is about 68.3.
On the cutoffs above, 68.3 predicts a score of 4, close to a 5. To reach 70, the student would need about 1.7 more composite points, which could come from two more multiple choice questions correct, or about three more free response points. That is a much clearer study target than simply trying to do better overall.
What Is a Good Score, and What Is Average?
Passing scores are 3, 4, and 5. Many colleges award credit for a score of 3 or higher, although each college sets its own AP policy, so check the schools you plan to apply to. A score of 5 is the top result, earned by roughly the top 14 percent of students in a typical year.
The average AP Statistics score is about 2.89, and about 60 percent of students score 3 or higher. Those numbers give context, but they should not discourage you. A focused student who practises both sections and learns to write clear free response answers can move well above the average, and a score of 4 or 5 usually earns college credit and shows strong statistical reasoning.
How to Use Your Result
A score calculator is most useful with real practice results, not guesses. Take a timed practice exam, score it honestly, and enter the two numbers. Read the predicted score, but also read the composite, because it tells you how far you are from the next band.
If your multiple choice part is much lower, work on speed and on topics that appear often in multiple choice, such as exploring data and probability. If your free response part is lower, practise full answers: state the question, show the calculation, check conditions for hypothesis testing, and interpret the p-value or confidence interval in context. A correct number without an explanation rarely earns full marks on free response.
Frequently Asked Questions
How do I calculate my AP Statistics score?
Add half of your multiple choice percentage and half of your free response percentage on a 0 to 100 scale. For example, 70 percent on multiple choice and 60 percent on free response gives a composite of 65, which predicts a score of 4.
What score do I need to pass AP Statistics?
Scores of 3, 4, and 5 are passing scores. Many colleges give credit for a 3 or higher, but policies vary, so check the AP credit policy at each college you are interested in.
How many multiple choice questions do I need right for a 5?
There is no fixed number, because the official conversion changes each year and free response matters just as much. As a rough guide, a composite of 70 or higher on a 0 to 100 scale is in the predicted range for a 5.
Is the score calculator result official?
No. The College Board sets the official conversion after the exam. A score calculator gives a prediction based on practice results and typical cutoffs, which is useful for planning but is not a guarantee.
Conclusion
Try the free Ap Stats Calculator at www.apstatscalculator.com to estimate your score from your own MCQ and FRQ results, and to practise normal distribution, binomial probability, t-test, chi-square test, and confidence interval calculations.
AP is a trademark of the College Board, which was not involved in the production of this site.