How to Get a 5 on AP Statistics: Exam Tips That Work
Learn how to get a 5 on AP Statistics with a realistic study plan, MCQ and FRQ strategies, calculator tips, and the most common mistakes to avoid on exam day.
Ap Stats Calculator
Ap Stats Calculator
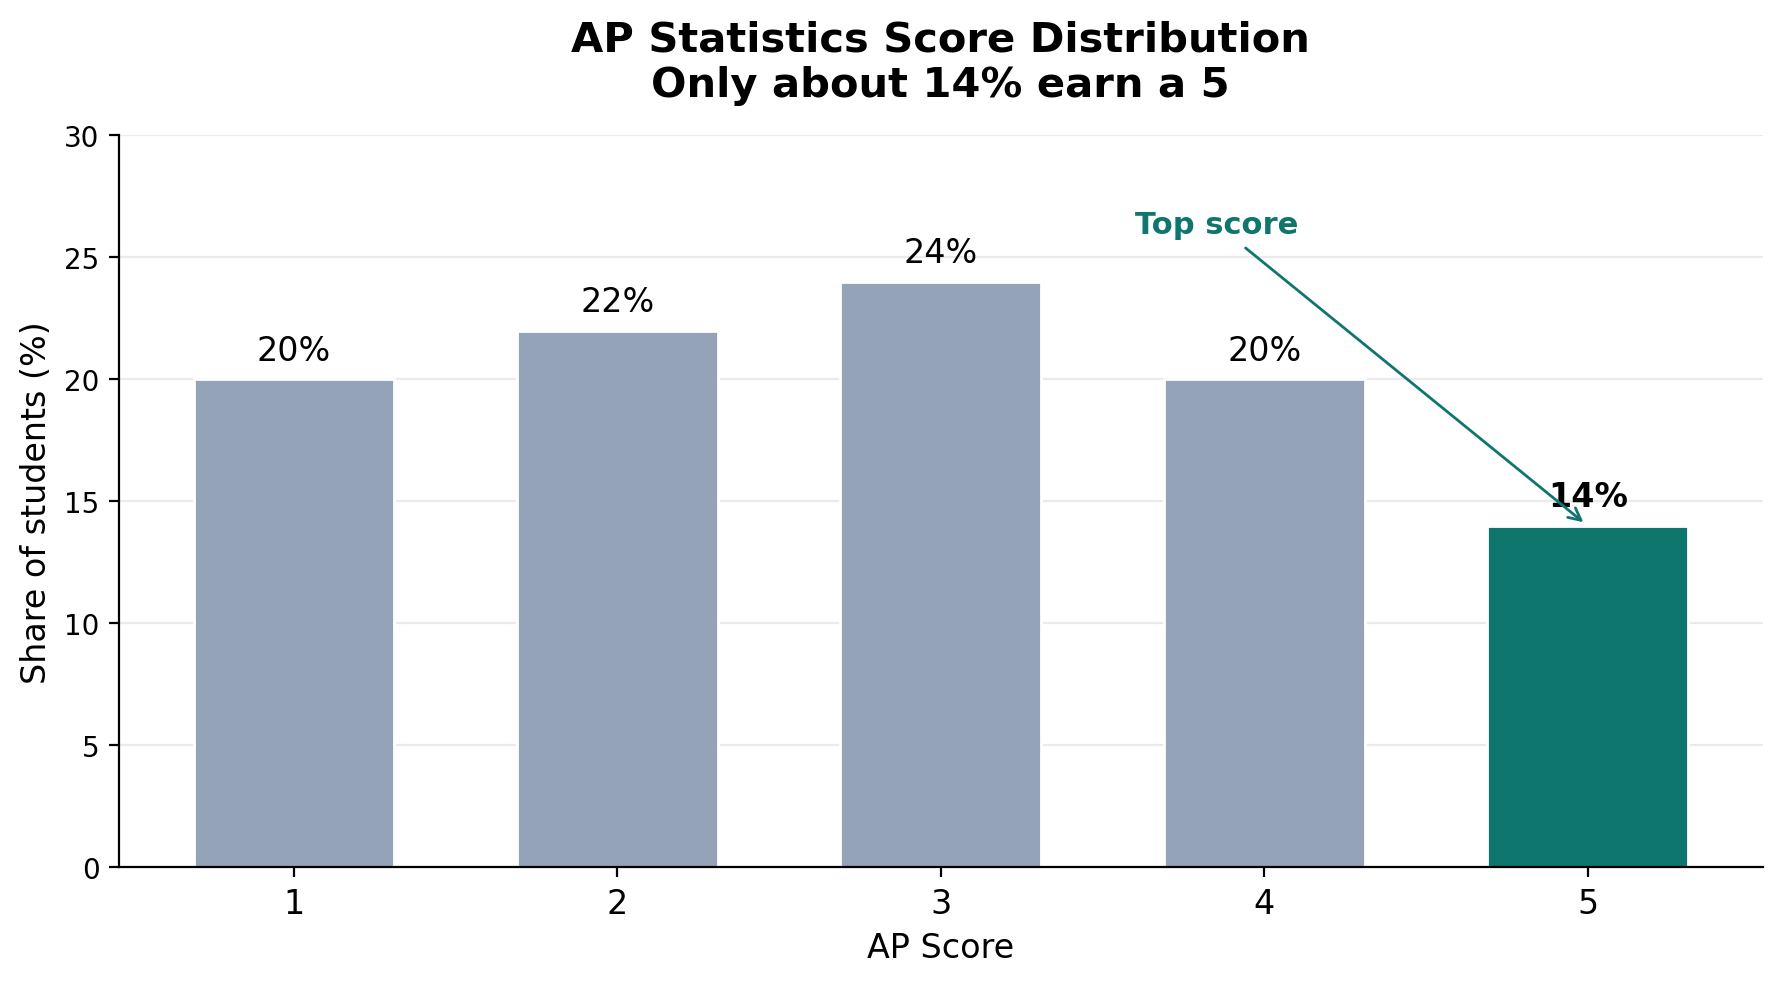
Getting a 5 on AP Statistics is demanding, but it is not a mystery. Students who reach it explain data clearly, use their calculator efficiently, and avoid small errors. The exam, run by the College Board, has 40 multiple-choice questions and six free-response questions. Both reward the same habits: read carefully, name the right method, check the conditions, and state a conclusion in context.
What a 5 Really Means
A score of 5 is the top score on the AP Statistics exam, earned by roughly the top 14% of students. That is useful context, not a reason to panic: a 5 requires accuracy under time pressure and clear written communication.
You do not need a perfect paper. You need strong, consistent work across both sections. Focus on points you can reliably earn: correct methods, correct conditions, and conclusions that answer the question asked.
A Realistic Study Plan
A realistic study plan beats an ambitious one you abandon after a week. Start by finding your weak areas: take a timed practice test, mark every question you guessed on, and sort errors by topic — exploring data, sampling and experimentation, probability, or statistical inference.
Then build a routine you can keep: three focused sessions per week, each 45 to 60 minutes. Use one for new review, one for practice problems, and one for free-response writing, which is a skill of its own. Spread review over weeks, revisiting probability and sampling regularly, and switch to full timed sections in the final two weeks to practise pacing and writing complete answers without notes.
Use practice scores to set targets, so you can spend the next week on the topics that will move your score most.
MCQ Strategy
The multiple-choice section has 40 questions in 60 minutes — about 90 seconds each. Do not spend the same time on every question. Answer the ones you know first, mark the harder ones, and return to them later. Four minutes on one question can cost you two easier questions.
Read the whole question before looking at the choices. Many questions test whether you notice a key detail: whether a sample is random, whether a variable is categorical or quantitative, or whether a study is an experiment or an observational study. Those details change the answer, even when the numbers look similar.
Eliminate choices that make a clear statistical error. Correlation does not prove causation, and a larger sample does not remove bias from a bad sampling method. Do not leave questions blank: there is no penalty for a wrong answer, so a thoughtful guess is always better than no answer.
FRQ Writing: Conditions and Conclusions
Free-response questions are where many strong students lose points, usually from incomplete communication rather than a lack of knowledge. Graders look for specific elements, so make each one easy to find.
Name the method first, such as a one-sample t-test for a mean or a two-proportion z-interval. Then state the conditions and check them with numbers from the problem, not just by writing “conditions are met.” For a t-procedure, mention random sampling, independence, and that the sample size is large enough or the population is approximately normal.
Show your work: the formula or calculator input, the test statistic, the p-value or interval, and the degrees of freedom when they apply. For a t-test, the degrees of freedom are usually one less than the sample size. For a confidence interval, report the interval itself, not only the sample mean at its centre.
Finish with a conclusion in context. In hypothesis testing, name the variables and the group studied, and explain the decision in plain language. If the p-value is small, say there is convincing evidence for the alternative claim. If it is large, say there is not convincing evidence — never that the null hypothesis is proven true.
Calculator Use: TI-84 Plus and TI-Nspire
A graphing calculator is allowed on the exam, and using it well saves time and reduces arithmetic errors. Most students use a TI-84 Plus, while others use a TI-Nspire. Either is fine, but be fluent with yours long before exam day; learning a new function during the exam wastes precious minutes.
Practise the functions you will use most: one-variable statistics, linear regression, normal distribution probabilities, binomial probabilities, and the built-in tests and intervals for means and proportions. Know how to find a p-value, a critical value, and a confidence interval without hunting through menus.
Remember that the calculator is a tool, not an answer. It can compute a test statistic, but it cannot tell you whether a normal model is appropriate or write your conclusion in context. Before the exam, check your batteries.
Common Point Losses to Avoid
Watch for these repeated errors:
- Skipping conditions. Stating a method without checking its conditions is a common way to lose free-response points.
- Answering a different question. If a question asks about a sample mean, do not answer about an individual value.
- Confusing correlation and causation. An observational study can show association, but it cannot prove causation.
- Misreading a graph. Check axes, scales, and units before describing shape, centre, or spread.
- Rounding too early. Keep full precision through your calculations and round only at the end.
- Weak conclusions. “The results are significant” loses points unless it says what is significant, for whom, and in what direction.
Review practice answers against a scoring guide to spot your repeated errors.
Frequently Asked Questions
How long should I study for AP Statistics each week?
Most students do well with three to five focused hours per week, plus extra timed practice in the final month. Consistency matters more than total hours.
Is AP Statistics mostly math or mostly writing?
It is both. The calculations are usually straightforward, but the writing carries a large share of the credit. You need to explain methods, justify choices, and interpret results in context.
Which calculator is best for AP Statistics?
The TI-84 Plus is the most common choice and fully handles the exam. The TI-Nspire is also allowed and works well if you already know it. The best calculator is the one you have practised with for months.
What score do I need for college credit?
That depends on the college. Many award credit for scores of 3 or higher, while others require a 4 or 5. Check each college’s AP credit policy.
Conclusion
Earning a 5 comes down to steady preparation, careful reading, and clear communication. Build a study plan you can keep, practise multiple-choice pacing, write complete free-response answers, and learn your calculator inside out.
Ready to see where you stand? Try the free Ap Stats Calculator at www.apstatscalculator.com to estimate your AP Statistics score from your practice results and plan your next study session with confidence.
Disclaimer: AP is a trademark of the College Board, which was not involved in the production of this site.