Linear Regression Calculator Guide: LinReg and Residuals
Use a linear regression calculator to find the least-squares line, interpret slope and intercept, check residuals, and run LinRegTTest for AP Statistics.
Ap Stats Calculator
Ap Stats Calculator
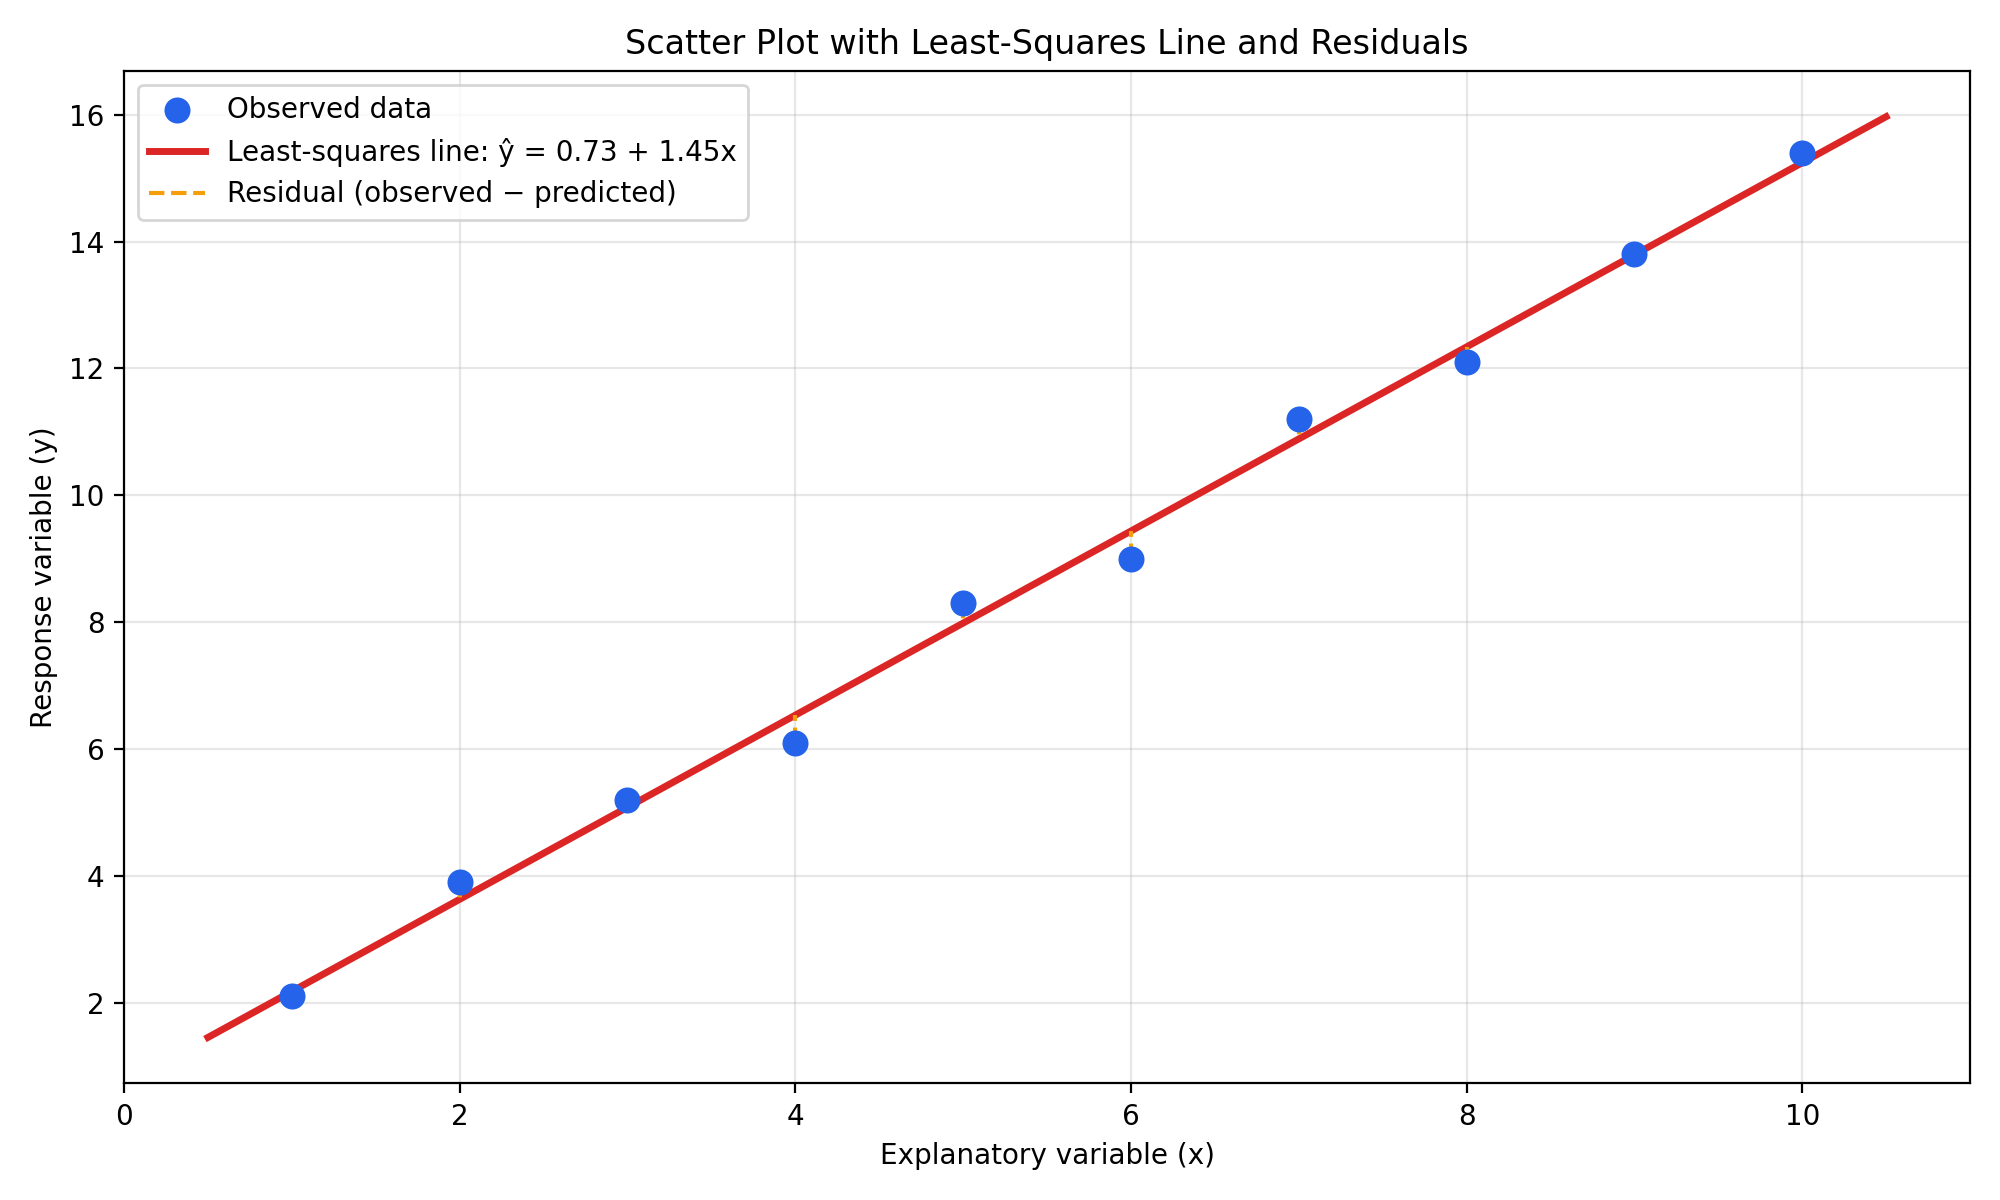
When two quantitative variables move together, regression analysis helps you describe that relationship with a line. A linear regression calculator does the arithmetic, so you can focus on what the line means and whether it fits well. This guide covers the process from a scatter plot to a significance test, in the way AP Statistics expects you to explain it.
Start With a Scatter Plot
Before you fit any line, plot the data. A scatter plot shows each pair of values as a point, with the explanatory variable on the horizontal axis and the response variable on the vertical axis. Look for the form, direction, and strength of the relationship: is it roughly linear or curved, rising or falling, tight or widely spread?
The Least-Squares Regression Line
The least-squares regression line is the line that makes the sum of the squared residuals as small as possible. It is written as ŷ = a + bx, where ŷ is the predicted response, a is the y-intercept, b is the slope, and x is the explanatory variable.
On a TI-84 Plus, find it with LinReg(a+bx) after entering your data in two lists. A free online linear regression calculator gives the same result. Check that you entered the lists in the right order: swapping x and y gives a different line.
Slope and Intercept: Interpret Them in Context
In AP Statistics, you must interpret the slope and intercept in context, using the units of the variables. The slope tells you how much the predicted response changes for a one-unit increase in the explanatory variable. For example, if the equation for predicting test scores from study hours is ŷ = 62 + 3.5x, the slope of 3.5 means that for each additional hour studied, the predicted test score increases by 3.5 points, on average.
The intercept is the predicted response when x = 0: here, the predicted score for a student who studied zero hours. If x = 0 is far outside the data, the intercept may not be a realistic prediction.
Correlation r and r-Squared
The correlation coefficient, r, measures the direction and strength of a linear relationship, from -1 to 1. Values near 1 or -1 show a strong linear pattern, values near 0 show a weak one, and the sign shows whether it is positive or negative.
The value r-squared, r², is the proportion of variation in the response variable explained by the linear relationship with the explanatory variable. If r² = 0.72, about 72% of the variation in y is explained by the model, and the rest is left in the residuals.
Residuals and Residual Plots
A residual is the difference between an observed value and the predicted value: residual = observed − predicted, or y − ŷ. A positive residual means the actual value sits above the line; a negative residual means it sits below it.
A residual plot graphs each residual against x, and it is one of the most useful checks in regression. Random scatter above and below zero supports a linear model. A curve or fan shape means the model is missing something. When the spread of residuals grows as x grows, the standard deviation of the residuals is not constant, and predictions become less reliable for larger values.
LinRegTTest and Statistical Inference
So far we have described one sample. Statistical inference asks whether the pattern is likely to hold in the larger population. The LinRegTTest tests whether the true slope of the population regression line is zero: is there convincing evidence of a linear relationship, or could the slope we see be due to chance?
The test gives a t-statistic and a p-value. A small p-value, usually below 0.05, means the observed slope would be unusual if the true slope were zero, so you have evidence of a real linear relationship. Check that the relationship is linear and the residuals show no clear pattern.
Worked Examples
Suppose a class collects data on study time and quiz scores. The sample mean study time is 4 hours, and the calculator gives ŷ = 58 + 4.2x, with r = 0.81 and r² = 0.66. The slope means that for each additional hour studied, the predicted quiz score increases by 4.2 points, on average. For a student who studies 6 hours, ŷ = 58 + 4.2(6) = 83.2. If that student actually scored 88, the residual is 88 − 83.2 = 4.8 points above the prediction. And r² means about 66% of the variation in quiz scores is explained by the linear relationship with study time.
Common Mistakes to Avoid
Extrapolation means predicting outside the range of the observed x-values. A line that fits well between 10 and 50 may be badly wrong at 100, because the relationship could change beyond the data. If you must predict outside the range, add a clear warning, or explain why the prediction is not reliable.
Correlation versus causation is another trap. A strong correlation does not prove that one variable causes the other: both could be affected by a third variable, or the link could be coincidence. On the AP Statistics exam, the College Board expects you to state this clearly rather than jumping to a causal claim.
Frequently Asked Questions
What is the difference between LinReg and LinRegTTest?
LinReg finds the least-squares line, slope, intercept, r, and r² for your sample. LinRegTTest tests whether the population slope is zero and gives a p-value for statistical inference about that slope.
How do I know if a linear model is appropriate?
Check the scatter plot for a roughly linear pattern and the residual plot for random scatter. If either shows a clear curve, a linear model is not the best choice, even if r is fairly high.
What does a pattern in a residual plot mean?
A pattern means the linear model missed part of the structure in the data. A curve often suggests a nonlinear model would fit better, while a fan shape suggests the spread of residuals is not constant.
Can I use a linear regression calculator on the AP Statistics exam?
Yes, a graphing calculator such as the TI-84 Plus or TI-Nspire is allowed, and you should know how to run LinReg and LinRegTTest on it.
Conclusion
A linear regression calculator is a powerful tool, but the line it produces is only useful when you understand it. Plot the data, interpret the slope and intercept in context, check r, r², and the residual plot, and use LinRegTTest carefully when you need inference.
Try it yourself with your own data. Use the free Ap Stats Calculator at www.apstatscalculator.com to enter your x and y values, find the least-squares line, and inspect the residuals and correlation in seconds.
Disclaimer: AP is a trademark of the College Board, which was not involved in the production of this site.