Normal Distribution Calculator Guide: normalcdf and invNorm
Normal distribution calculator guide: use normalcdf and invNorm on TI-84 and online, with z-scores, worked examples, and common mistakes explained simply.
Ap Stats Calculator
Ap Stats Calculator
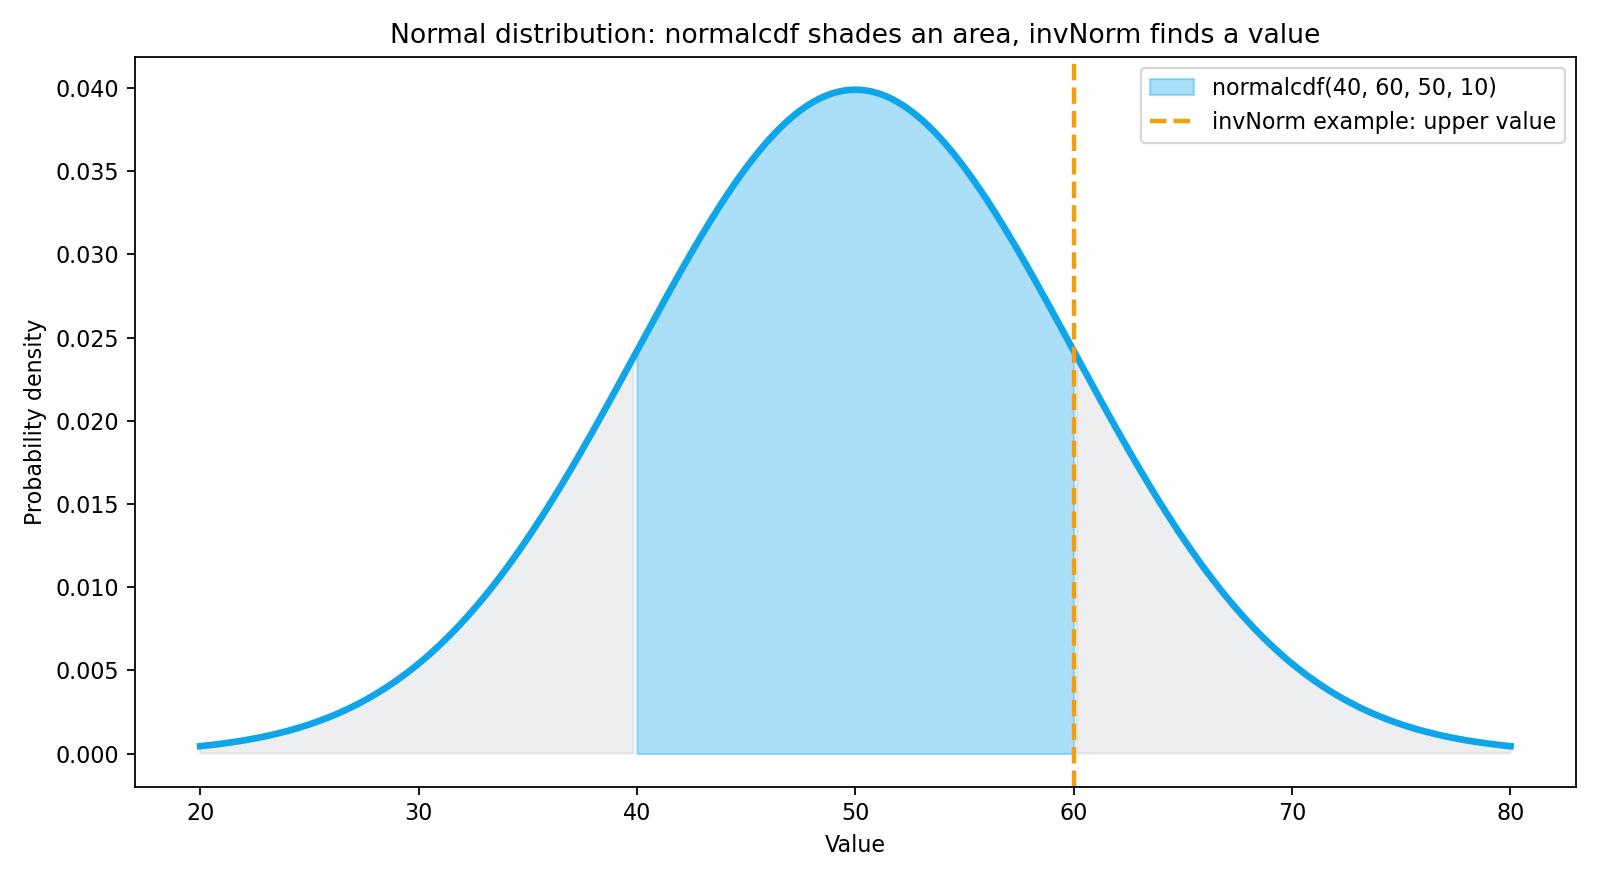
The normal distribution is the most useful distribution in AP Statistics, and two calculator functions handle almost every normal question: normalcdf and invNorm. One finds a probability from values, and the other finds a value from a probability. Once you know which direction a question is asking, the rest is just entering the right numbers in the right order.
What the Normal Distribution Describes
A normal distribution is a bell-shaped distribution described by two numbers: the mean, written as mu, and the standard deviation, written as sigma. The mean is the centre, where the peak sits. The standard deviation controls width. A small standard deviation gives a tall, narrow curve, because most values cluster near the mean. A large standard deviation gives a short, wide curve.
The z-score connects any normal value to the standard normal distribution, which has mean 0 and standard deviation 1. The formula is z equals x minus the mean, divided by the standard deviation. A z-score of 1 means one standard deviation above the mean, and a z-score of minus 1.5 means one and a half standard deviations below it.
normalcdf: From Values to Probability
Use normalcdf when the question gives you values and asks for a probability, proportion, or percentage. For example, what proportion of students score between 40 and 60, or what is the probability that a value is greater than 75? Those are normalcdf questions, because you start with values and end with an area under the curve.
On the TI-84 Plus, TI-84 Plus CE, and TI-Nspire, press 2nd, then DISTR, then choose normalcdf. Enter lower bound, upper bound, mean, and standard deviation, in that order.
For a probability between two values, enter both bounds. For a probability greater than a value, enter that value as the lower bound and 1E99 as the upper bound. For a probability less than a value, enter negative 1E99 as the lower bound and that value as the upper bound. Those numbers stand in for positive and negative infinity.
invNorm: From Probability to Value
Use invNorm when the question gives you a probability, percentile, or proportion and asks for the value that goes with it. For example, what score marks the top 10 percent, or what value is at the 90th percentile? Those are invNorm questions, because you start with an area and end with a value.
On the TI-84 Plus, press 2nd, then DISTR, then choose invNorm. It asks for the area to the left, the mean, and the standard deviation, so you may need to adjust first.
Worked Example 1: normalcdf
Suppose test scores are normally distributed with mean 50 and standard deviation 10. What proportion score between 40 and 60?
Enter normalcdf(40, 60, 50, 10). The result is about 0.6827, or 68.27 percent. That matches the empirical rule, because 40 and 60 are exactly one standard deviation below and above the mean.
Worked Example 2: invNorm
Using the same distribution, mean 50 and standard deviation 10, what score marks the 90th percentile? Enter invNorm(0.90, 50, 10). The result is about 62.8, so a score of about 63 is at the 90th percentile. Check it: 62.8 is 1.28 standard deviations above the mean, and a z-score of about 1.28 does correspond to the 90th percentile.
Now find the cutoff for the top 5 percent. The area to the left is 0.95, so enter invNorm(0.95, 50, 10). The result is about 66.4. If you entered 0.05 by mistake, you would get about 33.6, which is the bottom 5 percent cutoff, a useful reminder to always ask whether the area is to the left or to the right.
Common Mistakes With normalcdf and invNorm
The most common mistake is swapping inputs. Normalcdf expects lower, upper, mean, and standard deviation, in that order. InvNorm expects area, mean, and standard deviation. Entering the mean where the standard deviation belongs will give a plausible-looking number that is completely wrong.
The second mistake is using the wrong area for invNorm. Remember that invNorm uses the area to the left. For top percentages, subtract from 1 first. For middle percentages, split the leftover area between the two tails.
The third mistake is using a sample standard deviation when the question gives a population standard deviation, or using the standard deviation of the data when the question asks about a sampling distribution. For sampling distribution questions, use the standard error, which is the population standard deviation divided by the square root of n.
Sketch First, Then Calculate
A quick sketch helps even when you have a calculator. Draw the bell curve, mark the mean in the centre, mark the values from the question, and shade the area you need. That sketch tells you whether you need normalcdf or invNorm, whether the area should be large or small, and whether your final answer is reasonable.
Frequently Asked Questions
What is the difference between normalcdf and invNorm?
Normalcdf starts with values and returns a probability, an area under the normal curve. InvNorm starts with a probability or percentile and returns a value on the horizontal axis. If the question asks how likely, use normalcdf. If it asks what value, use invNorm.
How do I do normalcdf on a TI-84 Plus?
Press 2nd, then DISTR, then choose normalcdf, and enter lower bound, upper bound, mean, and standard deviation. For greater-than questions, use 1E99 as the upper bound. For less-than questions, use negative 1E99 as the lower bound.
How do I find the top 10 percent with invNorm?
Use the area to the left, which is 0.90 for the top 10 percent. Enter invNorm(0.90, mean, standard deviation). Entering 0.10 would give you the bottom 10 percent cutoff instead.
What is a z-score, and do I need it for normalcdf?
A z-score is how many standard deviations a value is from the mean, calculated as x minus the mean, divided by the standard deviation. You do not need it first for normalcdf, because the calculator handles the conversion, but it is a useful check and it appears in many AP Statistics questions on its own.
Conclusion
Normal distribution questions become much easier once you sort them by direction. Values to probability means normalcdf. Probability to value means invNorm. Add a quick sketch, check the input order, remember that invNorm uses the area to the left, and verify your answer against the empirical rule.
Try the free Ap Stats Calculator at www.apstatscalculator.com to practise normalcdf and invNorm with a live diagram that shades the area and updates as you change the mean, standard deviation, and bounds, and to check your work on hypothesis testing, t-tests, chi-square tests, confidence intervals, and p-value interpretation as well.
AP is a trademark of the College Board, which was not involved in the production of this site.