P-Value Explained: How to Interpret It Correctly
Learn what a p-value really means, how alpha levels work, and how to interpret t-test and chi-square results correctly in AP Statistics hypothesis testing.
Ap Stats Calculator
Ap Stats Calculator
Many AP Statistics students know the rule — reject the null hypothesis when the p-value is small — but cannot explain what that number means. A p-value is not a pass-or-fail stamp. It measures how surprising a sample result would be if the null hypothesis were true.
This guide explains that definition, shows how alpha levels work, and walks through a one-sample t-test and a chi-square test, so you can interpret p-values correctly on homework and on the AP Statistics exam.
What a P-Value Is (and What It Is Not)
In hypothesis testing, you start with a null hypothesis, H₀: a claim of no effect, no difference, or no association. You collect data and calculate a test statistic, which measures how far your sample result sits from what the null hypothesis predicts.
The p-value is the probability of getting a test statistic at least as extreme as the one observed, assuming the null hypothesis is true. That last phrase is essential. You are not finding the probability that the null hypothesis is true. You are asking: if the null model were correct, how unusual would this result be?
A small p-value, such as 0.01, means the result would be rare under the null hypothesis. A larger p-value, such as 0.40, means it is ordinary under that model. A p-value is also not a measure of effect size: a tiny p-value can come from a small effect in a large sample. Report it with the sample size, the estimate, and the study context.
Alpha Levels and Statistical Significance
Alpha (α), the significance level, is the threshold you set before looking at the data. Common choices are α = 0.05 and α = 0.01. If the p-value is less than or equal to alpha, you reject the null hypothesis; the result is statistically significant at that level. If it is greater than alpha, you fail to reject the null hypothesis. You never “accept” it or prove it true — the data simply did not provide enough evidence against it.
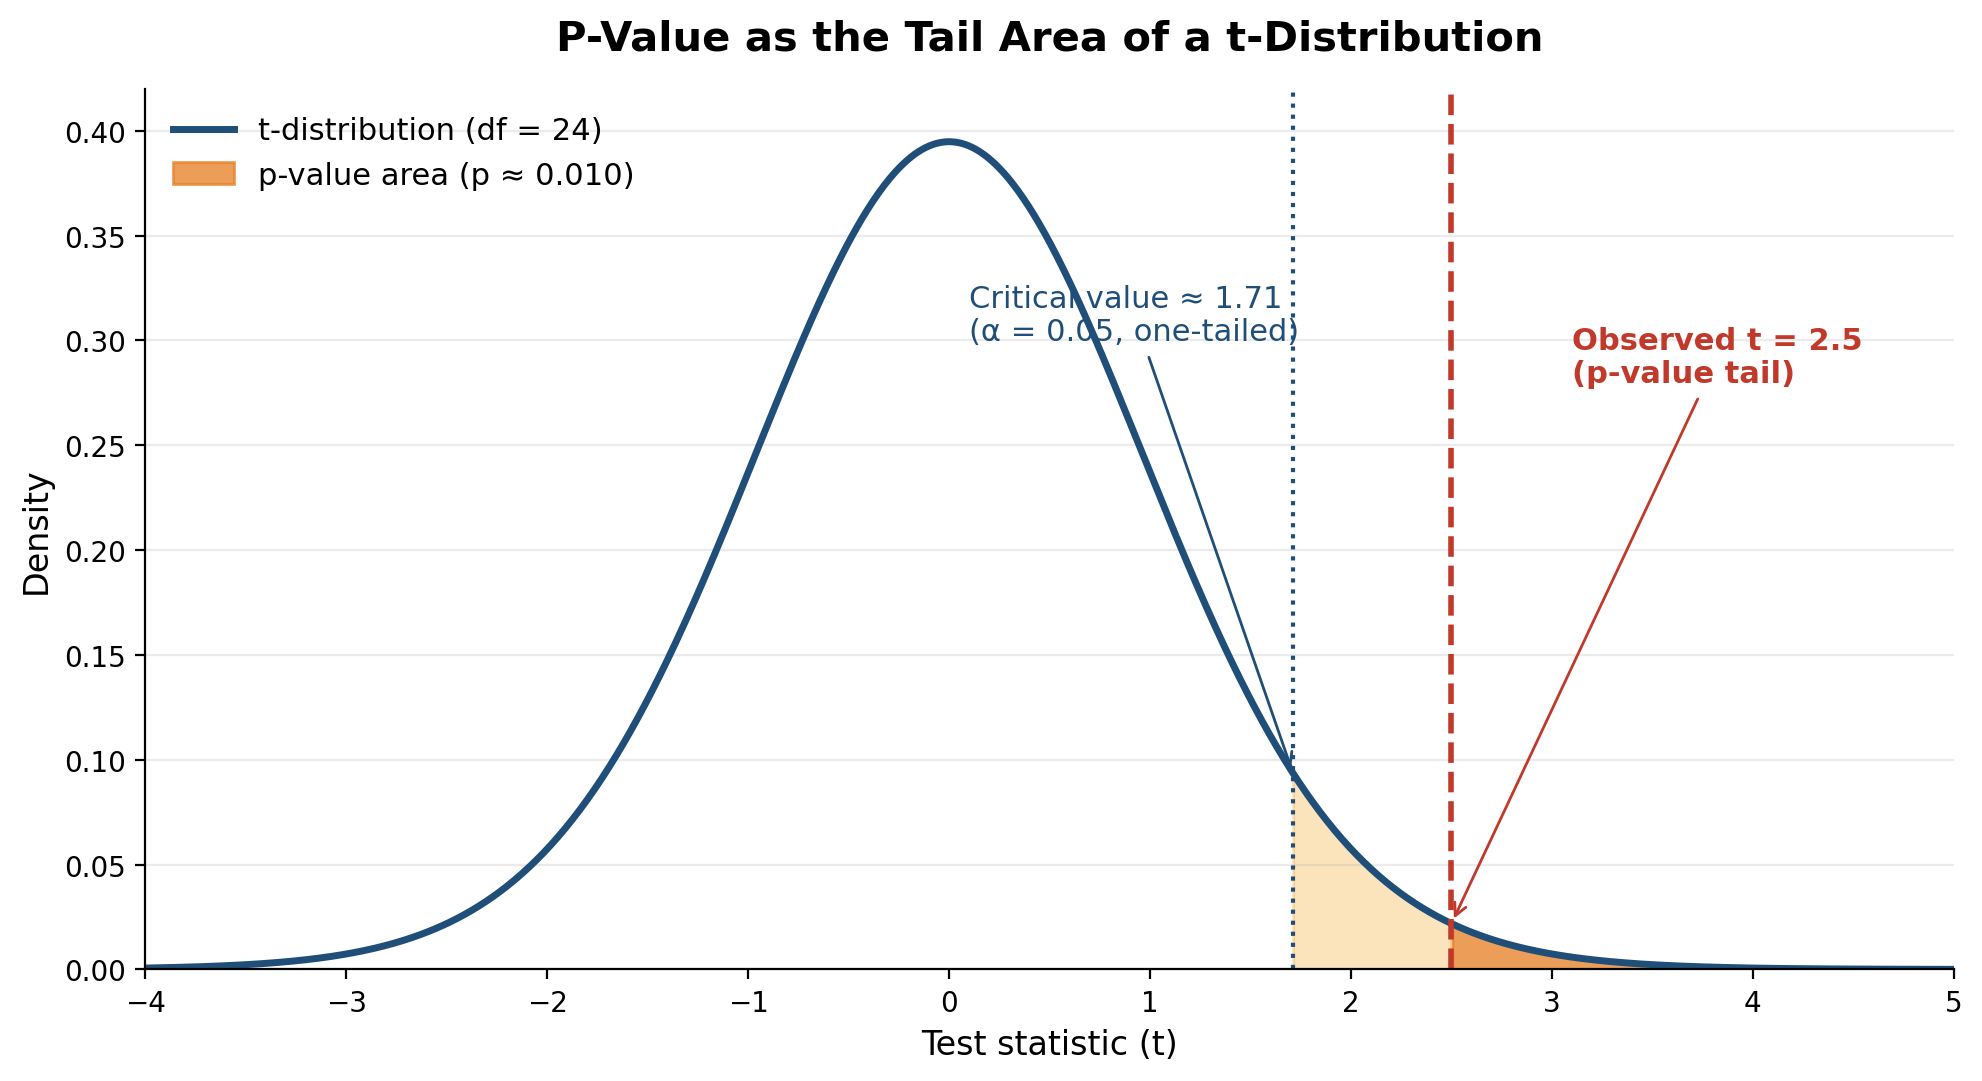
Alpha is also the probability of a Type I error: rejecting a true null hypothesis. With α = 0.05, that happens about 5% of the time over many studies. Choose alpha before analysis; moving it after seeing the p-value undermines statistical inference. In the chart above, the shaded tail is the p-value, and the rejection region beyond the critical value is where it falls below 0.05.
Worked Example: A One-Sample t-Test
A school claims its AP Statistics students study a mean of 5 hours per week outside class. A student suspects the true mean is higher and samples 25 students. The sample mean is 5.8 hours, with a standard deviation of 1.6 hours.
The hypotheses are H₀: μ = 5 versus Hₐ: μ > 5. Because the population standard deviation is unknown and the sample is small, use a one-sample t-test, not a normal distribution z-test:
t = (5.8 − 5) / (1.6 / √25) = 0.8 / 0.32 = 2.50
The degrees of freedom are n − 1 = 24, giving a one-tailed p-value of about 0.010. On a TI-84 Plus, enter the sample mean, standard deviation, sample size, and hypothesized mean in the T-Test function; the TI-Nspire offers the same inputs. The free Ap Stats Calculator gives the same result.
Since 0.010 is less than α = 0.05, reject H₀: there is convincing evidence the true mean exceeds 5 hours. This does not mean “there is a 1% chance the null hypothesis is true.” It means that, if the true mean were 5 hours, a sample mean of at least 5.8 hours would occur about 1% of the time.
Worked Example: A Chi-Square Test
P-values work the same way for categorical data. A teacher surveys 120 students about their favorite AP subject: 50 prefer Statistics, 40 prefer Biology, and 30 prefer Calculus. The null hypothesis is that each subject is equally popular, so each expected count is 120 / 3 = 40:
χ² = (50 − 40)² / 40 + (40 − 40)² / 40 + (30 − 40)² / 40 = 5.0
With 3 categories, the degrees of freedom are 3 − 1 = 2, and the p-value for χ² = 5.0 is about 0.082. At α = 0.05, this exceeds alpha, so you fail to reject the null hypothesis. The data do not provide convincing evidence that preferences differ.
A p-value of 0.082 is not “almost significant,” nor does it mean the null hypothesis is probably true. It means a chi-square statistic of 5.0 or larger would occur about 8.2% of the time when preferences are truly equal.
Common Misconceptions About P-Values
The College Board expects AP Statistics students to avoid these errors. First, a p-value is not the probability the null hypothesis is true. Second, 1 minus the p-value is not the probability your claim is correct. Third, failing to reject the null hypothesis does not prove it; a small sample may lack power to detect a real effect. Fourth, statistical significance is not practical importance — a significant result can be too small to matter.
State the p-value, compare it with alpha, and explain the conclusion in context: “With a p-value of 0.010, less than α = 0.05, there is convincing evidence the mean study time exceeds 5 hours per week.”
Frequently Asked Questions
What does a p-value of 0.05 mean?
If the null hypothesis were true, a test statistic at least as extreme as the one observed would occur about 5% of the time. At α = 0.05, it sits on the boundary for rejecting the null hypothesis.
Is a smaller p-value always better?
It is stronger evidence against the null hypothesis, but it does not mean the effect is larger or more important. Check the sample size and the observed difference.
What is the difference between a p-value and alpha?
Alpha is the significance level chosen before analysis, such as 0.05. The p-value is calculated from your data. Reject the null hypothesis when the p-value is less than or equal to alpha.
Can a p-value be greater than 1 or negative?
No. A p-value is a probability, so it always lies between 0 and 1. Values near 0 give strong evidence against the null hypothesis; values near 1 mean the data are very consistent with it.
Conclusion
A p-value answers one question: how surprising would this result be if the null hypothesis were true? Fix alpha in advance, compare the p-value with that threshold, and describe your conclusion in context rather than claiming proof.
Try it yourself with the free Ap Stats Calculator at www.apstatscalculator.com. Enter your sample mean, standard deviation, and sample size for a t-test, or your observed and expected counts for a chi-square test.
Disclaimer: AP is a trademark of the College Board, which was not involved in the production of this site.