T-Test Calculator Guide: One-Sample and Two-Sample
Learn the t-test step by step: hypotheses, test statistic, degrees of freedom, p-value, conditions, TI-84 T-Test steps, and worked one-sample examples.
Ap Stats Calculator
Ap Stats Calculator
A t-test is the tool AP Statistics students use when they test a claim about a population mean and the population standard deviation is unknown. That last point is important. If the population standard deviation were known, a z-test would be used. In real data, it almost never is known, so the sample standard deviation is used instead, and the t-distribution replaces the normal distribution. This guide covers one-sample and two-sample t-tests, the hypotheses, the test statistic, degrees of freedom, the p-value, the conditions, and the TI-84 steps.
What Is a T-Test?
A t-test compares a sample mean with a claimed value, or compares two sample means with each other, and asks whether the difference could reasonably be due to chance alone. The test statistic measures how many standard errors the sample result is from the claimed value.
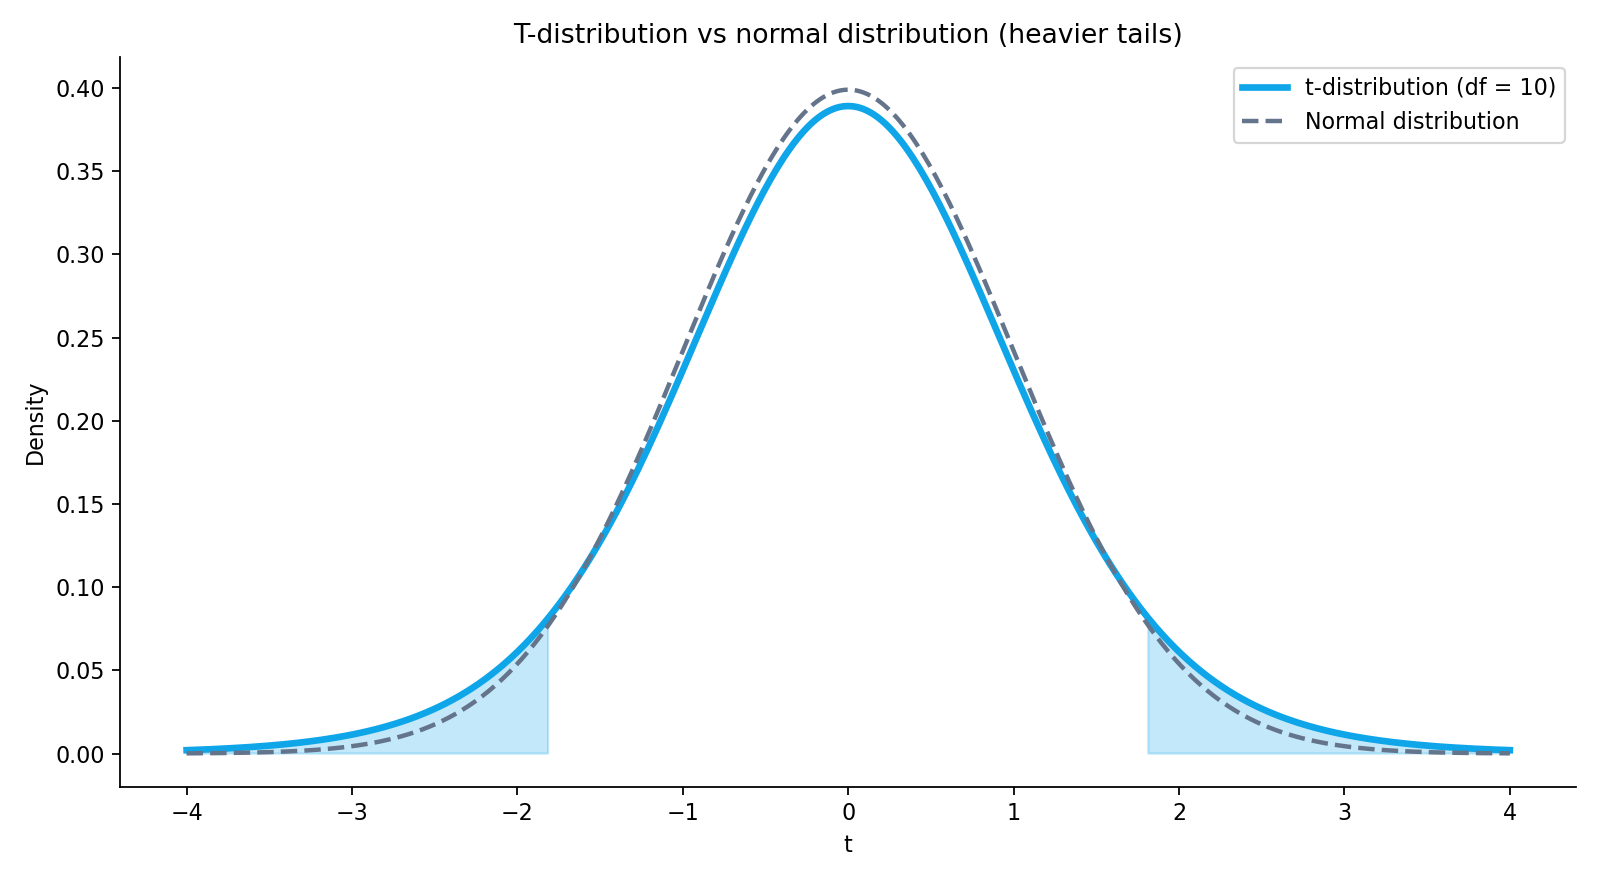
The t-distribution looks like the normal distribution, but with heavier tails. That means extreme values are more likely, which reflects the extra uncertainty from estimating the standard deviation from the sample. As the sample size grows, the t-distribution gets closer to the normal distribution. With small samples, the difference matters, so using a z-test by mistake can give a p-value that is too small.
One-Sample T-Test: Hypotheses and Formula
In a one-sample t-test, the null hypothesis states that the population mean equals a claimed value, written H0: mu equals mu0. The alternative hypothesis can be one-sided, mu greater than mu0 or mu less than mu0, or two-sided, mu not equal to mu0. The direction of the alternative must be decided from the question, not from the data after you have seen the result.
The test statistic is t equals the sample mean minus mu0, divided by the sample standard deviation divided by the square root of n. In symbols, t equals (x-bar minus mu0) divided by (s divided by the square root of n). The degrees of freedom are n minus 1. For example, a sample of 25 students has 24 degrees of freedom. The p-value is the probability, under the null hypothesis, of a test statistic at least as extreme as the one observed, in the direction of the alternative.
Two-Sample T-Test: Comparing Two Means
A two-sample t-test compares the means of two independent groups. The null hypothesis is that the two population means are equal, or that their difference is zero. The alternative can be one-sided or two-sided. The test statistic is the difference of the sample means divided by the standard error of the difference, which combines the standard deviations and sample sizes of both groups.
The two-sample t-test on a TI-84 Plus uses the 2-SampTTest command, not a pooled formula by hand in AP Statistics. The degrees of freedom are calculated by the calculator and are usually not a whole number. Do not round them up to a whole number before finding the p-value. Also, do not confuse a two-sample t-test with a paired t-test. Paired data, such as before and after measurements on the same people, must be analysed as a one-sample t-test on the differences. That distinction is tested often.
Conditions for a T-Test
Three conditions must be checked, and checked in words, not just named. First, random sampling or random assignment, depending on whether the goal is inference about a population or a cause-and-effect claim. Second, independence, usually checked with the 10% condition when sampling without replacement: the sample size should be no more than 10% of the population. Third, normality of the sampling distribution. For large samples, at least 30 is a common guideline, the central limit theorem helps. For small samples, the data itself should show no strong skew or outliers, which you check with a dotplot, stemplot, or boxplot.
TI-84 T-Test Steps
On a TI-84 Plus or TI-84 Plus CE, press STAT, then TESTS, then choose T-Test for one sample or 2-SampTTest for two samples. Choose Data if you have raw values in a list, or Stats if you have the summary statistics. Enter mu0, the sample mean, the sample standard deviation, and n, then choose the alternative direction. Choose Calculate, not Draw, if you want the numeric output quickly, though Draw can help you see the shaded p-value region. The output gives t and p. Write both down, with the degrees of freedom, before you interpret them.
A common TI-84 error is entering the population standard deviation, sigma, where the sample standard deviation, Sx, belongs. Another is choosing the wrong alternative direction, which halves or doubles the p-value in a way that changes the conclusion. A third is using 2-SampTTest for paired data. Check the data structure before you choose the test.
Worked Example: One-Sample T-Test
A teacher claims that students spend a mean of 60 minutes per night on homework. A random sample of 20 students has a mean of 68 minutes and a standard deviation of 15 minutes. Is there evidence that the true mean is greater than 60 minutes? The hypotheses are H0: mu equals 60 and Ha: mu greater than 60. The test statistic is (68 minus 60) divided by (15 divided by the square root of 20), which is about 2.39. With 19 degrees of freedom, the one-sided p-value is about 0.014. At a 5% significance level, this is strong enough to reject the null hypothesis. In context, there is convincing evidence that the mean homework time is greater than 60 minutes.
Frequently Asked Questions
When do I use a t-test instead of a z-test?
Use a t-test when the population standard deviation is unknown and you use the sample standard deviation instead. Use a z-test only when the population standard deviation is known, which is rare with real data, or for proportions with large samples.
What are the degrees of freedom for a one-sample t-test?
The degrees of freedom are n minus 1, where n is the sample size. For a two-sample t-test, let the calculator find the degrees of freedom, and do not round them before finding the p-value.
What does a small p-value mean?
A small p-value means the observed result would be unusual if the null hypothesis were true. It is not the probability that the null hypothesis is true, and it does not prove the alternative hypothesis.
Should I use a paired t-test or a two-sample t-test?
Use a paired t-test when the same subjects are measured twice, such as before and after, and analyse the differences with a one-sample t-test. Use a two-sample t-test only for two independent groups.
Conclusion
A t-test is a clear, step-by-step argument: state the hypotheses, check the conditions, calculate the test statistic and p-value, and interpret the result in context. The TI-84 does the arithmetic, but the reasoning, especially the conditions and the p-value interpretation, is what earns marks. Try the free Ap Stats Calculator at www.apstatscalculator.com to practise t-tests, check your test statistic and p-value, and build confidence before the exam.
AP is a trademark of the College Board, which was not involved in the production of this site.