Z-Score Calculator Guide
Learn how to calculate a z-score, read percentiles on a normal distribution, and use a TI-84 or free online z-score calculator with clear worked examples.
Ap Stats Calculator
Ap Stats Calculator
A z-score tells you where one value sits compared with the rest of a distribution. It puts different numbers on the same scale, so you can find a percentile, compare scores from different tests, and work with probabilities on a normal distribution. A z-score calculator does the arithmetic: enter a value, the mean, and the standard deviation, and it returns the z-score and often the matching percentile.
The Z-Score Formula
The formula is:
z = (x - mean) / standard deviation
In symbols, z = (x - μ) / σ for a population, or z = (x - x̄) / s for a sample, where x̄ is the sample mean. First subtract the mean, then divide by the standard deviation. That turns the distance from the centre into a count of standard deviations, independent of the original units.
What a Z-Score Means
The sign tells you the direction: positive is above the mean, negative is below it, and zero equals the mean. The size tells you how unusual it is. A z-score near zero is typical, 1 or -1 is fairly common, and 2 or beyond is less common. In statistical inference, that helps you judge whether a result is ordinary or surprising. Always state both direction and distance when you interpret a z-score.
Standard Deviation
Standard deviation measures spread: on average, how far values fall from the mean. A small value means values cluster close to the mean; a large one means they spread out widely. It is also the unit you count in. If two students both score 10 points above the mean, the one on a test with a standard deviation of 5 has z = 2, while the one on a test with a standard deviation of 20 has z = 0.5. The first score is far more unusual, even though the raw gap is the same. Do not confuse it with standard error, which describes the spread of a sample mean over repeated sampling.
Percentiles and the Normal Distribution
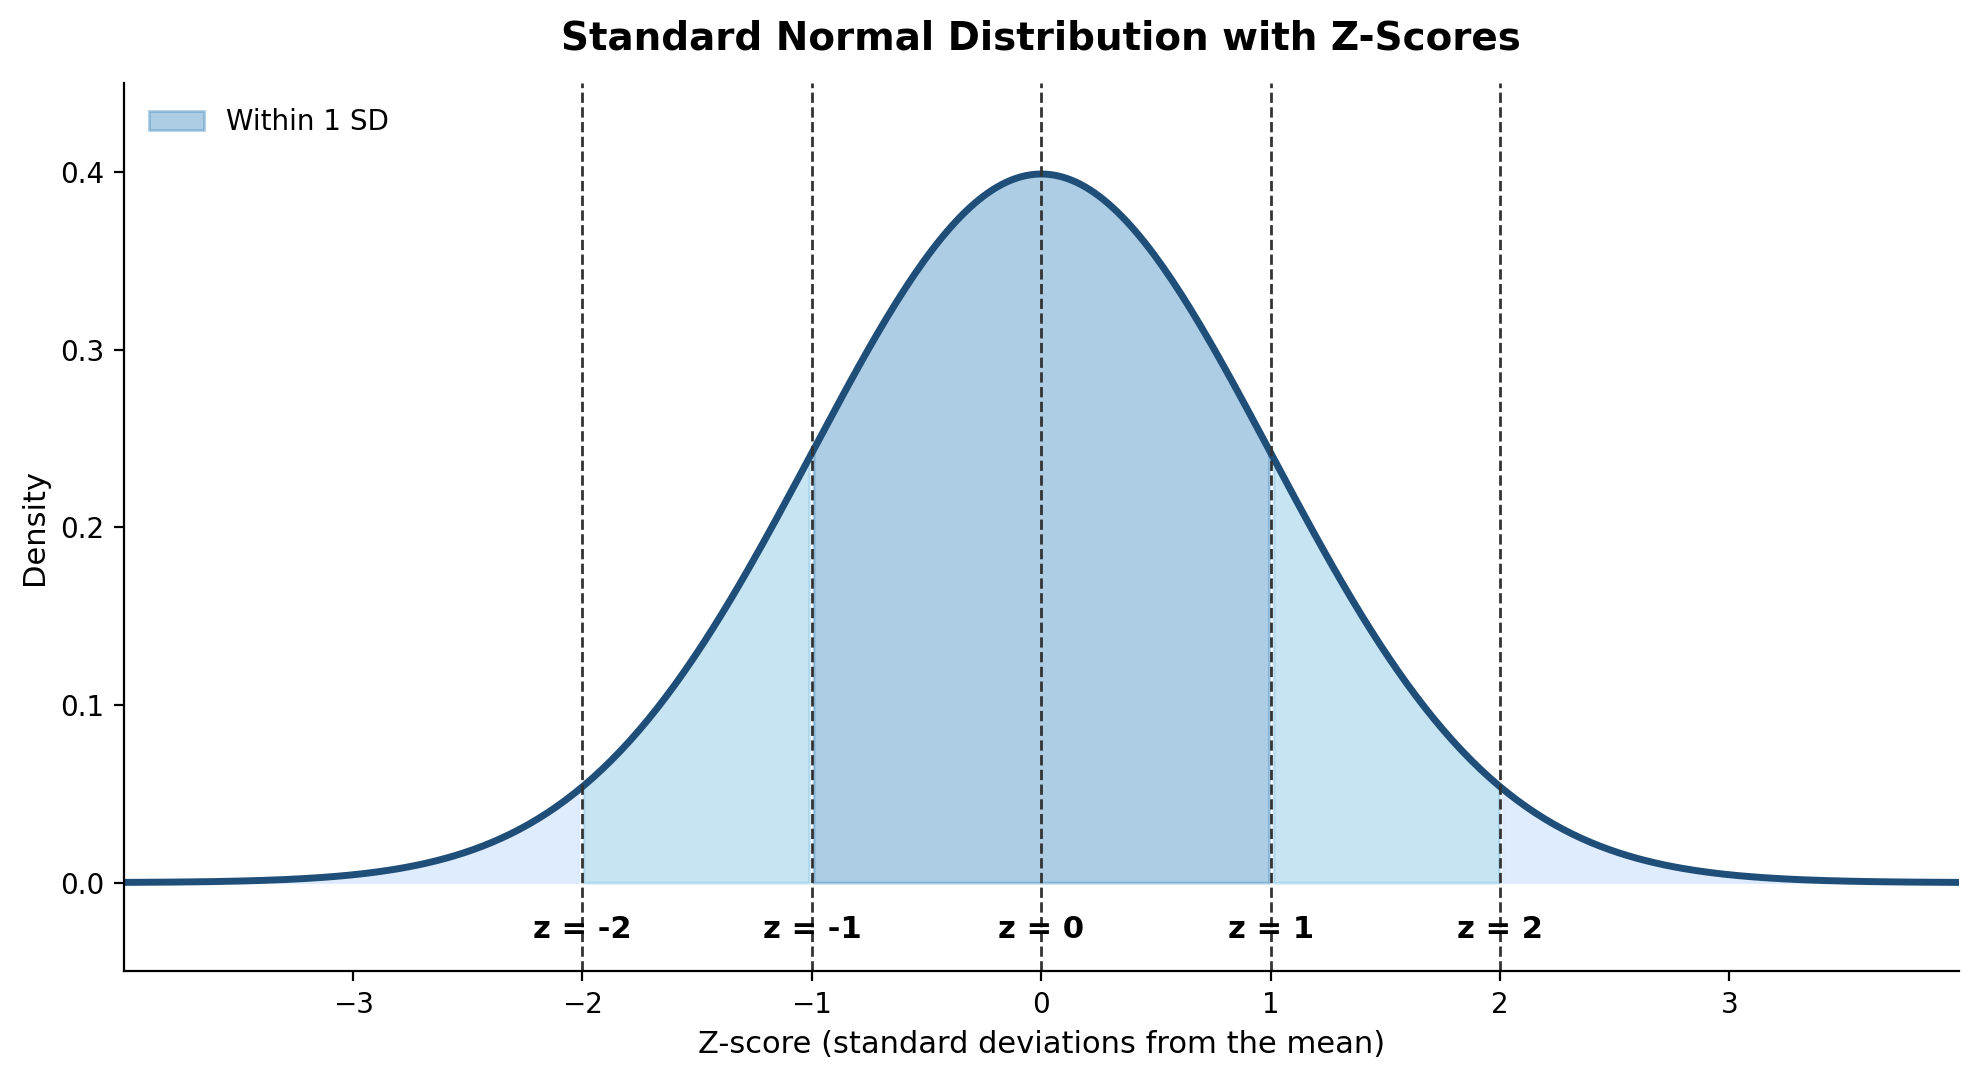
A percentile tells you what share of values fall below a given value. At the 84th percentile, about 84 percent are below and 16 percent are above. On a normal distribution, each z-score matches one percentile. The standard normal distribution, shown above, has a mean of 0 and a standard deviation of 1 — exactly the z-score scale. About 68 percent of values fall between z = -1 and z = 1, about 95 percent between z = -2 and z = 2, and about 99.7 percent within three standard deviations. This is the 68-95-99.7 rule. For an exact percentile, find the area to the left of the z-score: z = 0 is the 50th percentile, z = 1 is about the 84th, and z = -1 is about the 16th.
Worked Examples
Example 1: A Value Above the Mean
A test has a mean of 70 and a standard deviation of 8. Maya scores 82.
z = (82 - 70) / 8 = 12 / 8 = 1.5
Her score is 1.5 standard deviations above the mean, about the 93rd percentile.
Example 2: A Value Below the Mean
On the same test, Liam scores 62.
z = (62 - 70) / 8 = -8 / 8 = -1.0
His score is 1 standard deviation below the mean, about the 16th percentile. Keep the negative sign.
Example 3: Comparing Two Values
Priya scores 88 on a test with a mean of 80 and a standard deviation of 5. Omar scores 92 on a test with a mean of 78 and a standard deviation of 10. Who did better relative to their class?
Priya: z = (88 - 80) / 5 = 1.6 Omar: z = (92 - 78) / 10 = 1.4
Priya did better in relative terms, despite Omar’s higher raw score.
TI-84 Steps and Online Calculator Steps
TI-84 Plus Steps
For the z-score itself, type (value - mean) / standard deviation on the home screen. For a percentile, use the DISTR menu (2nd, then VARS) and normalcdf with a very low lower bound, the z-score as the upper bound, a mean of 0, and a standard deviation of 1. For example, normalcdf(-999, 1.5, 0, 1) gives about 0.933, the 93rd percentile. To find a z-score for a percentile, use invNorm: invNorm(0.90, 0, 1) gives about 1.28. The same functions work on a TI-Nspire, with a slightly different menu layout. In a hypothesis test, normalcdf also gives the p-value: the probability of a result at least as extreme as the test statistic.
Online Calculator Steps
- Choose the z-score calculator on the Ap Stats Calculator site.
- Enter the value, the mean, and the standard deviation.
- Check you have not swapped the mean and the standard deviation.
- Read the z-score, including its sign, and the percentile with it.
- Write your answer in context, for example: “1.5 standard deviations above the mean.”
The College Board allows approved graphing calculators, including the TI-84 Plus and the non-CAS TI-Nspire, on the AP Statistics exam. An online calculator cannot replace those on exam day.
Common Mistakes
- Dropping the negative sign. A z-score below the mean must stay negative.
- Subtracting in the wrong order. Always do value minus mean.
- Dividing by the wrong spread. Use the standard deviation, not the variance or standard error, unless the question asks for a sampling distribution.
- Mixing up percentile and percentage above. A percentile is the share below a value; subtract it from 100 percent for the share above.
- Assuming normality. Normal-curve percentiles only apply when the distribution is approximately normal.
- Reporting only a number. Interpret the z-score: distance, direction, and meaning in context.
Frequently Asked Questions
What is a z-score calculator?
It finds how many standard deviations a value is from the mean, using (value - mean) / standard deviation, and often reports the matching percentile.
How do I find a z-score on a TI-84?
Type (value - mean) / standard deviation on the home screen. For a percentile, use normalcdf(-999, z, 0, 1) from the DISTR menu. For a z-score from a percentile, use invNorm(percentile, 0, 1).
What does a negative z-score mean?
The value is below the mean. For example, z = -1 means one standard deviation below the mean, about the 16th percentile on a normal distribution.
Can a z-score compare scores from different tests?
Yes. Convert each score using its own mean and standard deviation, then compare the z-scores. The higher z-score is better relatively, even if its raw score is lower.
Conclusion
A z-score turns a raw value into a clear, comparable measure: how far it sits from the mean, counted in standard deviations. Learn the formula, practise reading percentiles, and check your work with a TI-84 Plus or an online tool.
Try the free Ap Stats Calculator now at www.apstatscalculator.com and check your z-score and percentile in seconds.
Disclaimer: AP is a trademark of the College Board, which was not involved in the production of this site.